


Data Acquisition and Automation of an Ice Cream Production Line

January 24, 2024
An international ice cream manufacturer needed to improve the quality of the chocolate spraying process conducted by production line machinery. The ultimate aim was to automate the ice cream cone line. Dewesoft provided an off-the-shelf solution securing stable cone quality using infrared cameras and data analysis software.
Our client is a renowned international ice cream manufacturer. You've likely had the chance to enjoy one of their delicious ice creams at least once.
Operational across more than 20 countries, this company demonstrates its proficiency in offering an extensive array of ice cream products. Their offerings span from timeless cones to tubs and beyond. This wide-ranging variety, combined with its widespread reach, has significantly bolstered its stature as a leading international distributor.
An automated ice cone production process typically involves the following steps:
Mixing: Automated equipment mixes large batches of the ice cone mixture, ensuring consistent quality.
Freezing: Industrial freezing equipment ensures a continuous and efficient freezing process.
Molding, shaping, and spraying: Specialized machines quickly and precisely mold the frozen mixture into cone shapes, while others sprinkle additional ingredients, e.g., chocolate or cream, on or into the cones.
Quality control: Automated quality control measures to ensure that each ice cone meets specified standards, shape, size, texture, and flavor.
Packaging: Automated systems efficiently package the ice cones into containers or wrappers, often at a high speed.
Objective
The collaboration with Dewesoft stemmed from the necessity to scrutinize and appraise the quality of the chocolate spraying process conducted by a production line machine. The ultimate aim was to automate the production line of ice cream cones. The client sought a solution that would liberate the staff from the continuous vigilance over the quality of each piece manufactured.
Within the scope of this pursuit, economic considerations and quality-related apprehensions emerged as primary motivators. Quality signifies excellence across every facet of the produced unit.
When we refer to the economic rationale, it's important to clarify that it doesn't imply a cost-saving strategy through operator layoffs. Quite the opposite. The objective is to relieve the operator from machine-related tasks, allowing them to apply their skills to high-value-added activities.
As we understand well, in most instances, pieces that do not meet the required quality standards are not recycled but rather disposed of as waste. You can envision the implications for a company that produces an ice cream cone every 1.5 seconds when a machine malfunctions and generates non-conforming pieces. Can't you?
Performing a rapid calculation, if only 1% of the ice creams produced fail to meet quality standards, we would have 24 non-conforming pieces per hour. Extrapolating, in a production line that operates for 24 hours, this would accumulate to a staggering 576 discarded ice creams every day.
No company can afford to bear such waste. Consequently, Dewesoft was engaged to undertake a feasibility study to pinpoint a solution that would enable the automation of the production process to detect non-compliant pieces. This solution should build on informed decisions and proactive execution of the necessary corrective measures.
The underlying vision driving these production improvements is to propel the company into an Industry 4.0 paradigm with advanced sensors, software, and robotics integrated into the machinery. These components facilitate the collection and analysis of data, leading to a more streamlined and sophisticated decision-making process.
These digital technologies ensure greater automation, predictive maintenance, and self-optimization of process improvements. And most importantly, a new level of efficiency and responsiveness that translates into an improved service provided to the end customer.


Measurement setup
Production lines consist of a sequence of machinery that runs continuously and should not stop during their production cycle. Hence, the measurement setup chosen for this type of analysis must be minimally intrusive. It must ensure it doesn’t disrupt or affect the regular operation of the machines.
We implemented an infrared (IR) thermal camera combined with specially configured DewesoftX software. The selected thermal camera was the Optris XI 400, which combines the advantages of a robust and compact pyrometer with the functionalities of an infrared camera.


The camera was connected using the Dewesoft Optris plugin. It is a software module that adds support for data visualization, analysis, and storage of Optris Thermovison cameras. It supports models XI400, PI400, and PI640. A single thermal camera with a 302 x 288 pixels resolution was employed to conduct these tests.
We positioned the thermal camera to frame only one of the six rows of cones advancing simultaneously.
The effectiveness of this configuration lies in its simplicity, further enhanced by Dewesoft's user-friendly architecture and ease of implementation.
To accurately capture all the essential parameters for the analysis of the spraying quality, it was crucial to create a customized bracket. This bracket was attached to a mechanical arm and designed to position the thermal camera at an elevated point above the row of cones. The goal was to direct the optics downward, capturing exclusively the edges and interiors of the cones.


Data acquisition and post-processing
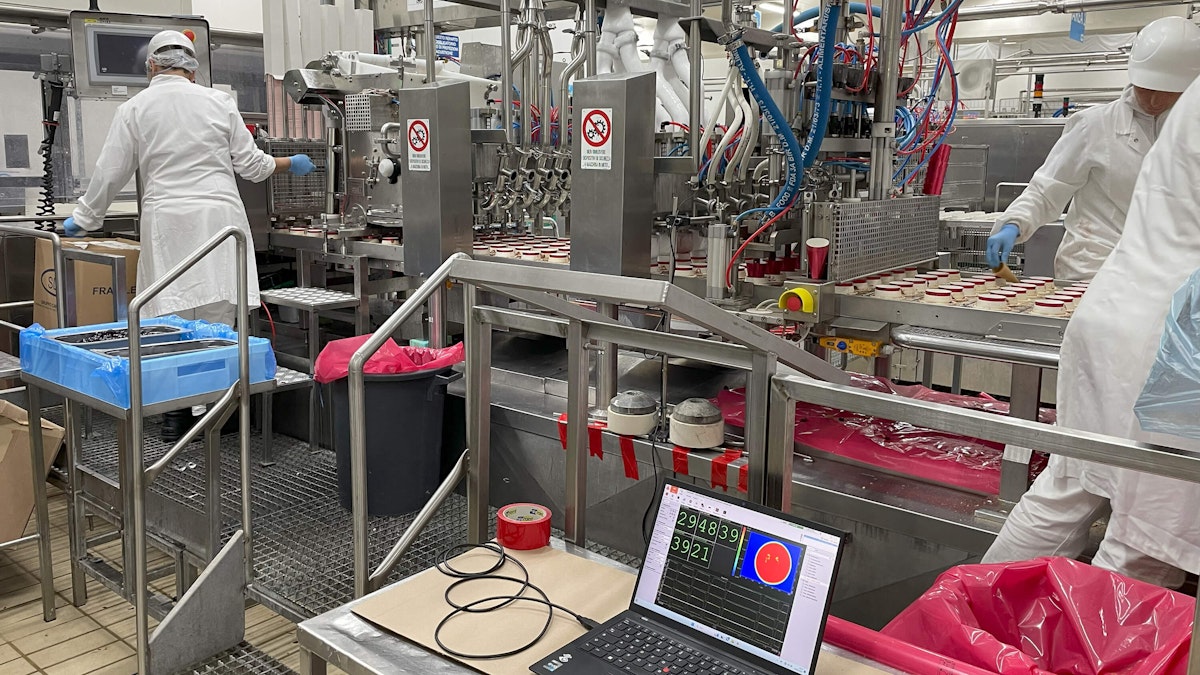
On June 28, 2023, we conducted measurements at the company’s Italian facility. The testing session lasted approximately one hour. During this hour, we collaborated with plant operators and maintenance engineers. Their experience allowed us to simulate various scenarios that can occur when there are issues with the nozzle or the pressure system.
The DewesoftX software consistently acquired and processed the entire data stream in real-time within the testing period. We could immediately present the variations in values and images captured clearly by the thermal camera whenever specific issues occurred.
After collection, we could process the data offline, extracting the relevant parameters indicating the spray's condition. The implemented mathematical operations include:
Using the "Latch" mathematical function to capture and store the recorded value at the moment of the activation of the line advancement trigger.
Using "Basic Statistics" to analyze all the recorded data samples and provide functional values for defining the threshold values that distinguish conforming products from non-conforming ones.
Logical conditions that, based on identified parameters, allow for changing the status of an LED intuitively displayed on the screen, indicating whether each cone is conforming or non-conforming.
Through suitable mathematical formulas, we could also institute a counter identifying defective pieces and associating these with the total count of manufactured items. This computation yielded a value that mirrors the comprehensive efficiency and performance of the production line.
Data analysis
By analyzing the complete dataset we could pinpoint the parameters that characterize the standard operation of the chocolate spraying machine.
This identification was crucial for comparing these data with those obtained during the occurrence of each problematic scenario. It also allowed us to define the threshold values to determine whether a piece is conforming or non-conforming.
We applied fundamental statistical analyses to the thermal camera data, including minimum, maximum, mean, median, and peak-to-peak values. These analyses yielded a distinct reference to the customary values that define the machine's regular operation.
Figure 5 is a screenshot of the acquired data file, depicting the outcomes stemming from these mathematical procedures.


On the left, you can observe the values promptly computed whenever the trigger event was triggered. This event occurred every time the thermal camera detected the movement of a new unit.
At the top, moving from left to right, you find the absolute value obtained by employing fundamental statistical methods on all samples captured within the acquisition interval. This approach generated a single meaningful value that we could juxtapose with the actual values gathered when the line is operational.


Cases observed
By analyzing the gathered data, we were able to investigate all the scenarios that can emerge when problems occur during chocolate spraying. Being able to operate during these scenarios enabled us to identify the significant parameters required when any of these issues arose:
Reduction in spraying pressure
This problem can arise from improperly configured machine settings or other factors resulting in a reduction in the nozzle discharge of hot chocolate. The consequences of this diminished pressure include an overall chocolate coverage that falls below the required standard and more uneven areas due to the reduced amount of sprayed material. As a result, the chocolate fails to adhere rightly to the waffle cone.


Partial nozzle obstruction
This problem arises from the buildup of material within the nozzle, obstructing the flow of chocolate and reducing its fluidity and uniformity. As a result, the material sprayed onto the waffle cone is unevenly distributed and displays irregular areas.


Complete nozzle obstruction
This problem arises from a complete blockage in the chocolate emission channel or nozzle. Incorrect machine settings can also lead to blockage and a total spray pressure of zero. The outcome of this blockage is a cone devoid of chocolate, where a colder and more heterogeneous area is visible due to the absence of hot sprayed material.


Following the data analysis, we identified and implemented multiple methods to detect non-conforming units. Once we established the "threshold" parameters that differentiate compliant from non-compliant products, integrating them into simple mathematical equations was straightforward.
Logical conditions control these equations that, in real-time, furnish an assessment of the quality of the freshly produced item. Production errors are computable using four distinct modes, which operate concurrently and are not mutually exclusive:
Peak-to-peak analysis
Peak-to-peak value analysis, representing the difference between the maximum and minimum values, unveils areas inadequately covered by hot chocolate. This measurement consistently provides valuable insights. A high peak-to-peak value undoubtedly indicates areas not adequately covered by chocolate.
However, the opposite is not always true. A low peak-to-peak value does not necessarily confirm the piece's conformity - as highlighted in the using the maximum.


Using the mean
The mean value indicates the uniformity of the chocolate-sprayed surface. The lower the mean value, the larger the area inadequately covered by chocolate.
Using the mean allows for easy identification of extensive sections on waffle cones not properly sprayed. Unlike other methods that wouldn't reveal this discrepancy with a single value. For instance, values below 41° indicate an issue. A reduced mean value can also signify a small covered area, even if it's regular, possibly due to low pressure during spraying.


Using the maximum
An exceedingly low maximum value signifies a reduction in nozzle pressure, hindering the adequate coverage of the entire waffle cone. In such circumstances, relying solely on peak-to-peak assessment would yield misleading results. The maximum value decreases notably and approaches the recorded minimum values. The result is a peak-to-peak difference that may fall within the range defined as okay or normal.


Using the minimum
Noticeably low minimum values indicate that the area captured by the camera fails to register proper coverage, implying the existence of entirely uncovered sections due to inadequate pressure or a possible nozzle obstruction.


Integration with production line automation
In the final configuration, designed to automate the entire production line, the following devices are planned:
Deployment of N thermal cameras, where N is equal to the number of lanes producing ice cream cones.
One digital input signal to time the acquisition and calculation of parameters at the precise moment of line advancement.
N digital output signals to provide a binary value to the production line automation.
The measurement and comparison of current ice cream values enable line automation and swift removal of non-compliant products through a dedicated machine within the production line. The outcomes derived from the algorithms described earlier we used to monitor a series of digital outputs that enabled us to reject non-compliant products by automation.
Furthermore, by implementing specific algorithms in DewesoftX software, it is possible to define, after a series of iterations, a value signaling the need to initiate predictive maintenance actions via ongoing monitoring. The objective is to schedule maintenance interventions before the machines on the line, or even the production line itself, start exhibiting signs of performance deterioration, thereby avoiding costs associated with unplanned machine downtime.
The advantage of this solution is the simplicity of implementation. It is an off-the-shelf hardware and software architecture that unobtrusively can be implemented in the line.