Table of contents
Browse categories
Browse authors
 AB
ABAlberto Boffi
 AL
ALAlessia Longo
 AH
AHAl Hoge
 AB
ABAljaž Blažun
 BJ
BJBernard Jerman
 BČ
BČBojan Čontala
 CF
CFCarsten Frederiksen
 CS
CSCarsten Stjernfelt
 DC
DCDaniel Colmenares
 DF
DFDino Florjančič
 EB
EBEmanuele Burgognoni
 EK
EKEva Kalšek
 FB
FBFranck Beranger
 GR
GRGabriele Ribichini
Glacier Chen
 GS
GSGrant Maloy Smith
 HB
HBHelmut Behmüller
 IB
IBIza Burnik
 JO
JOJaka Ogorevc
 JR
JRJake Rosenthal
 JS
JSJernej Sirk
 JM
JMJohn Miller
 KM
KMKarla Yera Morales
 KD
KDKayla Day
 KS
KSKonrad Schweiger
Leslie Wang
 LS
LSLoïc Siret
 LJ
LJLuka Jerman
 MB
MBMarco Behmer
 MR
MRMarco Ribichini
 ML
MLMatic Lebar
 MS
MSMatjaž Strniša
 ME
MEMatthew Engquist
 ME
MEMichael Elmerick
 NP
NPNicolas Phan
 OM
OMOwen Maginity
 PF
PFPatrick Fu
 PR
PRPrimož Rome
 RM
RMRok Mesar
 RS
RSRupert Schwarz
 SA
SASamuele Ardizio
 SK
SKSimon Kodrič
 SG
SGSøren Linnet Gjelstrup
 TH
THThorsten Hartleb
 TV
TVTirin Varghese
 UK
UKUrban Kuhar
Valentino Pagliara
 VS
VSVid Selič
 WK
WKWill Kooiker
Automated Disconnection Time for Inverter Island Testing
Jeykishan Kumar K, Engineering Officer Grade-2, CPRI, and Logesh N U
Central Power Research Institute (CPRI)
May 28, 2024
Inverter islanding testing is fundamental and vital. Islanding is the critical and unsafe condition in which a distributed generator, such as a solar power system or a wind turbine, continues to supply power to the grid while the electric utility is down. Automated measurement of disconnection time can improve safety and save much time. In such a scenario, Dewesoft featured tailored software to meet testing needs.
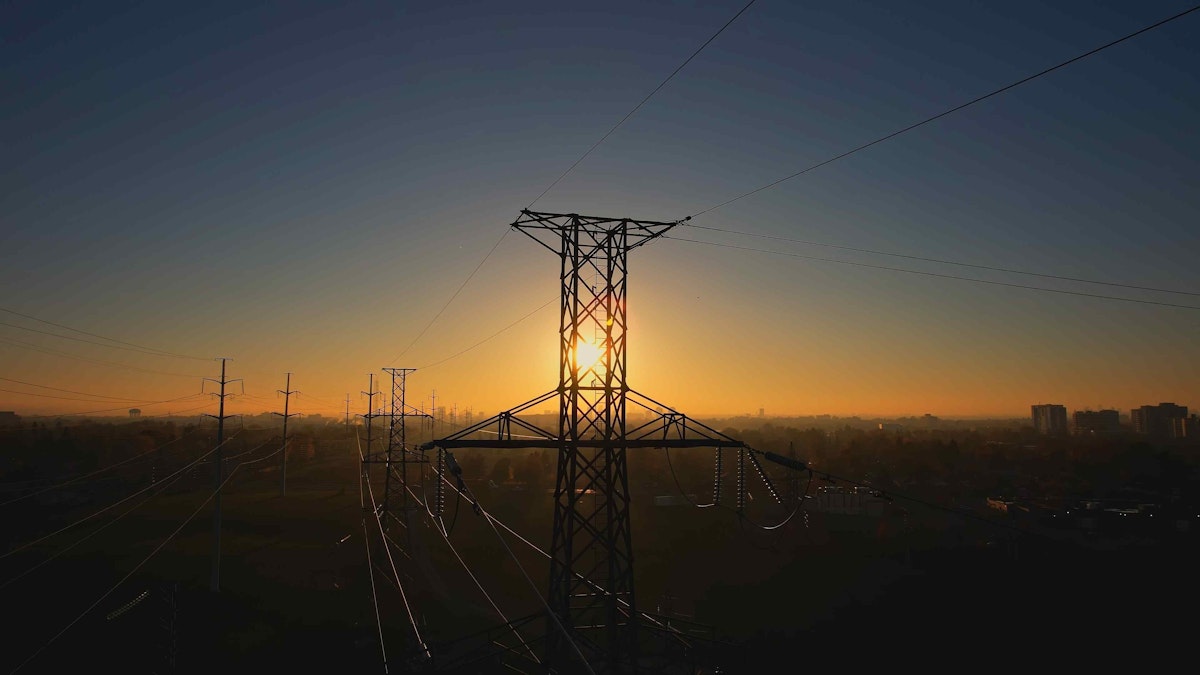
Imagine a quiet neighbourhood humming with the humdrum of daily life. The power lines carry the electricity, connecting each home to the grid. Then, suddenly, a glitch in the grid occurs, triggering the phenomenon known as islanding.
The neighbourhood is isolated and cut off from the electrical network. Light and appliances flicker uncertainly, caught in voltage imbalances. Maintenance workers expecting a dormant power grid approach the downed lines. And step into a danger zone as the islanded energy source stubbornly holds its ground.
The islanding disconnection time refers to the duration it takes for a distributed energy resource (DER), such as a solar power system with an inverter, to disconnect from the electrical grid after detecting an islanding condition.
The shorter, the better. The effects of inverter islanding can have both safety, operational, and equipment implications:
Safety Concerns
Worker Safety: Workers may expect the power to be off when performing maintenance or repair work on the electrical grid. If an inverter is islanding, it can pose a safety risk.
Voltage Disturbances: Islanding can lead to voltage imbalances affecting the stability and safety of electrical devices connected to the grid.
Operational Challenges
Grid Stability: Islanding can affect the stability of the larger electrical grid. When an islanded system continues to supply power, it may introduce stability issues.
Frequency Mismatch: An islanded system may have a different frequency than the grid, causing synchronization problems when attempting to reconnect.
Equipment Damage
Appliance Damage: The sudden power restoration from an islanded system to a grid can cause a surge of electricity, potentially damaging sensitive electronic equipment connected to the grid.
Distributed energy resources, including inverters, are designed with anti-islanding protection features to achieve rapid disconnection. The detection methods employed by the inverter, the response time of protective relays, and the overall design of the DER system influence the disconnection time.
Organizations and regulatory bodies have established islanding standards for DERs and inverters to ensure safe and reliable electrical grid operation. Inverter compliance with relevant standards and regulations is essential to address safety and operational concerns associated with islanding effects.
CPRI - grid-tied inverter test laboratory
The Central Power Research Institute (CPRI) is the powerhouse of the Indian electrical industry. Set up in 1960 by the Government of India, CPRI is a center for applied research in electrical power engineering.
The institute assists the electrical industry in product development and quality assurance and serves as an independent authority for power equipment testing and certification. CPRI's governing body includes eminent professionals from industries and utilities, prestigious academic and research institutions, and Government representatives.
The Institute can undertake all mandatory testing for inverter manufacturers for registration under the Bureau of Indian Standards (BIS). With the addition of a 500kW testing facility, the Grid Connected Inverter Testing Laboratory, CPRI in Bengaluru, has become India’s largest grid-tied inverter testing hub. Some major testing activities associated with the laboratory are,
Photovoltaic systems - Power conditioners - Procedure for measuring efficiency (IS/ IEC 61683:1999 (Reaffirmed 2015)),
Safety of power converters for use in photovoltaic power systems (IS 16221-1: 2016/ IEC 62109-1:2010: Part 1: General requirements),
Safety of power converters for use in photovoltaic power systems (IS 16221-2:2015/ IEC 62109-2:2011: Part 2: Particular requirements for inverter) and
Test procedure of islanding prevention measures for utility-interconnected photovoltaic inverters (IS 16169:2014/ IEC 62116:2008).
The sophisticated test facility, combining flexibility and expertise in the field, can even meet customized testing requirements for the industry.
As per the order of the Ministry of New and Renewable Energy (MNRE), Solar Photovoltaics, Systems, Devices, and Components Goods (Requirements for Compulsory Registration) Order, 2017 and following an MNRE gazette 29 July 2022, producers must register Solar Photo Voltaic (SPV) Inverters under compulsory registration scheme (CRS). The quality control order requires solar PV inverters to be tested by a BIS-recognized laboratory.
This order is applicable for Solar Photo Voltaic (SPV) based Off Grid, Grid-Tied, and Hybrid Inverters of capacities up to 150KW with a PV voltage rated 1000/1100Vdc max and AC voltage 415V ac Nominal.
The order requires producers to test the on-grid Inverters as per IS 16221 and IS 16169 standard and off-grid inverters as per IS 16221 to get the product registered under CRS. As per the guidelines, manufacturers have to submit a declaration of the series of their products while submitting the samples of a particular series for testing.
Solution instrumentation
The specific test procedure for islanding testing involves creating a controlled environment to simulate grid failure and evaluating how quickly the inverter detects the islanding condition and disconnects from the grid.
For this purpose, the Grid Testing Facility has acquired a Dewesoft multi-channel power analyzer (High Sampling), Dewesoft SIRIUS HS with arbitrary channels for temperature, etc.
10 Channels for High Voltage ( AC/DC )
10 Channels for Current ( AC/DC )
4 Channels for Temperature
The Dewesoft SIRIUS HS (High Speed) amplifiers are suitable for power analysis applications and allow synchronous efficiency analysis of the complete energy flow, both AC and DC power. These amplifiers are suited for recording fast transients and applications requiring a high sampling rate.
CPRI chose the SIRIUS HS series DAQ system for this measurement as it combines high bandwidth with alias-free signal acquisition and can measure with a sample rate of up to 1 MS/sec. The Dewesoft DAQ devices are fully modular, meaning the institute can use multiple devices simultaneously, measuring different parameters with all channels fully synchronized.
The SIRIUS DAQ system has an anti-aliasing filter combinable with an infinite impulse response filter (IIR) inside the field-programmable gate array (FPGA). These filter solutions are standard and can be activated or deactivated as required.
On the one hand, the Low Voltage amplifier (SIRIUS HS-LV) combined with the 16-bit ADC technology allows for low voltage measurements even at high measurement ranges, e.g., µV resolution at a range of ± 10V. The measurement setup in DewesoftX allows setting these voltage levels.
On the other hand, the High Voltage amplifier (SIRIUS HS-HV) allows the direct measurement of voltages up to 1600V DC. In this case, the grid voltage could be measured directly with the built-in amplifiers without additional voltage transducers.
List of instruments
Hardware
Dewesoft SIRIUS R2 HUB- data acquisition
SIRIUSir-HS-8xHV
SIRIUSir-HS-8xLV
SIRIUSir-HS-Custom-2xHV-6xLV
SIRIUSir-PWR-MCTS2
Dewesoft SIRIUSi-HD-PWR-MCTS2
Dewesoft DSI-TH-K - Sensor Interface
LEM LF 2010-S - LEM Current Sensor-2000A
Ametek ETS1000Y15D - DC Power Source
Ametek 5702499-01 - RLC Load
Scientific PSD 3210 - DC Source
Software
DewesoftX Professional
Dewesoft-OPT-POWER
Test procedure
To achieve the specified load and EUT output conditions, we test the inverters following IS 16169:2014 and IEC 62116:2008, defining a test procedure of islanding prevention measures for utility-interconnected photovoltaic inverters.
This test ensures the inverter prioritizes safety by stopping the power supply to the grid during an outage. The stop prevents potential dangers to utility workers and emergency responders working on de-energized lines.
This test verifies the inverter's ability to detect and disconnect from the grid (anti-islanding protection) within a specified timeframe during a power outage.
In short, the test procedure includes three steps:
Simulate grid connection and ensure standard inverter operation.
Simulate a grid power loss (de-energization).
Monitor the inverter's output current.
More practically, the procedure is:
Determine EUT Output Power
Adjust the DC input source
S1 closed, S2 opened
Turn EUT ON, Measure EUT power output
Measure real, reactive power, frequency, utility power(real and reactive)
Real power = reactive power for utility
Turn OFF EUT and Open S1
Adjust RLC load to have Qf = 1 ± 0.05
Inductive reactance = EUT real power
The inductor is the first element
Adjust capacitor to have : QC + QL = - Q EUT
Connect the resistor to have power consumed by the RLC circuit = P EUT
Connect RLC load as per item 4 and Close S2.
Close S1 and turn the EUT ON
Adjust RLC to have I AC to be 0 A through S1 with 1 % tolerance
Disconnect S1 to initiate the test.
Run on time, tR recorded
For test condition A, adjust the real load and only one reactive component by approximately 1% per test within the range of 95% to 105%.
If run-on times rise, increase 1% increments until run-on time decreases.
You may achieve Test C load conditions using inverter control to limit output power rather than power supply limit.
The inverter must disconnect from the grid and cease supplying current within two seconds from the moment the grid loses power (de-energization) to pass the test.
Pass - The inverter output current drops to zero within two seconds of the simulated grid power loss.
Fail - The inverter output current does not reach zero within two seconds, indicating a potential safety hazard during an actual power outage.
Measurements
The table below, Table 1, shows measurements observed from the 125kW Grid Tie Solar String Inverter tested following the IS 16169/IEC 62116 standard for islanding protection under various power-flow scenarios.
Tested condition and run-on time
| Sl. No | PEUT (a) % of EUT Rating | Reactive load (% of QL) | PAC (b) (% of nominal) | QAC (c) (% of nominal) | Run On-time (ms) | PEUT (kW) | Pr (resis tive) kW | Pl (Inductive) kVAr | Pc (Capacitive) kVAr | Actual Qf | V DC | Remarks (d) |
|---|---|---|---|---|---|---|---|---|---|---|---|---|
| 1 | 100 | 100 | 0 | 0 | 264 | 125.0 | 124.6 | 124.6 | 129.4 | 0.97 | 800 | Test A at BL |
| 2 | 66 | 66 | 0 | 0 | 206 | 81.0 | 81.4 | 81.4 | 84.8 | 0.97 | 600 | Test B at BL |
| 3 | 33 | 33 | 0 | 0 | 181 | 40.0 | 40.2 | 40.2 | 41.7 | 0.95 | 340 | Test C at BL |
| 4 | 100 | 100 | -5 | -5 | 178 | 125.0 | 130.9 | 124.6 | 135.6 | 0.95 | 800 | Test A at IB |
| 5 | 100 | 100 | -5 | 0 | 178 | 125.0 | 130.9 | 124.6 | 129.4 | 0.93 | 800 | Test A at IB |
| 6 | 100 | 100 | -5 | 5 | 190 | 125.0 | 130.9 | 124.6 | 123.2 | 0.91 | 800 | Test A at IB |
| 7 | 100 | 100 | 0 | -5 | 185 | 125.0 | 124.6 | 124.6 | 135.6 | 1.01 | 800 | Test A at IB |
| 8 | 100 | 100 | 0 | 5 | 224 | 125.0 | 124.6 | 124.6 | 123.2 | 0.96 | 800 | Test A at IB |
| 9 | 100 | 100 | 5 | -5 | 187 | 125.0 | 118.4 | 124.6 | 135.6 | 1.04 | 800 | Test A at IB |
| 10 | 100 | 100 | 5 | 0 | 195 | 125.0 | 118.4 | 124.6 | 129.4 | 1.03 | 800 | Test A at IB |
| 11 | 100 | 100 | 5 | 5 | 200 | 125.0 | 118.4 | 124.6 | 123.2 | 1.00 | 800 | Test A at IB |
| 12 | 66 | 66 | 0 | -5 | 179 | 81.0 | 82.5 | 82.5 | 88.6 | 0.99 | 600 | Test B at IB |
| 13 | 66 | 66 | 0 | -4 | 184 | 81.0 | 82.5 | 82.5 | 87.8 | 0.98 | 600 | Test B at IB |
| 14 | 66 | 66 | 0 | -3 | 174 | 81.0 | 82.5 | 82.5 | 87.0 | 0.98 | 600 | Test B at IB |
| 15 | 66 | 66 | 0 | -2 | 177 | 81.0 | 82.5 | 82.5 | 86.1 | 0.98 | 600 | Test B at IB |
| 16 | 66 | 66 | 0 | -1 | 186 | 81.0 | 82.5 | 82.5 | 85.3 | 0.97 | 600 | Test B at IB |
| 17 | 66 | 66 | 0 | 1 | 318 | 81.0 | 82.5 | 82.5 | 83.7 | 0.96 | 600 | Test B at IB |
| 18 | 66 | 66 | 0 | 2 | 232 | 81.0 | 82.5 | 82.5 | 82.8 | 0.95 | 600 | Test B at IB |
| 19 | 66 | 66 | 0 | 3 | 373 | 81.0 | 82.5 | 82.5 | 82.0 | 0.95 | 600 | Test B at IB |
| 20 | 66 | 66 | 0 | 4 | 251 | 81.0 | 82.5 | 82.5 | 81.2 | 0.94 | 600 | Test B at IB |
| 21 | 66 | 66 | 0 | 5 | 239 | 81.0 | 82.5 | 82.5 | 80.4 | 0.95 | 600 | Test B at IB |
| 22 | 33 | 33 | 0 | -5 | 153 | 40.0 | 41.6 | 41.6 | 45.3 | 0.98 | 340 | Test C at IB |
| 23 | 33 | 33 | 0 | -4 | 150 | 40.0 | 41.6 | 41.6 | 44.9 | 0.98 | 340 | Test C at IB |
| 24 | 33 | 33 | 0 | -3 | 168 | 40.0 | 41.6 | 41.6 | 44.5 | 0.97 | 340 | Test C at IB |
| 25 | 33 | 33 | 0 | -2 | 176 | 40.0 | 41.6 | 41.6 | 44.1 | 0.97 | 340 | Test C at IB |
| 26 | 33 | 33 | 0 | -1 | 171 | 40.0 | 41.6 | 41.6 | 43.7 | 0.94 | 340 | Test C at IB |
| 27 | 33 | 33 | 0 | 1 | 222 | 40.0 | 41.6 | 41.6 | 42.8 | 0.94 | 340 | Test C at IB |
| 28 | 33 | 33 | 0 | 2 | 205 | 40.0 | 41.6 | 41.6 | 42.4 | 0.95 | 340 | Test C at IB |
| 29 | 33 | 33 | 0 | 3 | 217 | 40.0 | 41.6 | 41.6 | 42.0 | 0.94 | 340 | Test C at IB |
| 30 | 33 | 33 | 0 | 4 | 236 | 40.0 | 41.6 | 41.6 | 41.6 | 0.95 | 340 | Test C at IB |
| 31 | 33 | 33 | 0 | 5 | 249 | 40.0 | 41.6 | 41.6 | 41.2 | 0.94 | 340 | Test C at IB |
A. PEUT: EUT output power.
B. PAC: Active power flow at S1 in Figure 1. Positive means power from EUT to utility. Nominal is the 0 % test condition value.
C. QAC: Reactive power flow at S1 in Figure 1. Positive means power from EUT to utility. Nominal is the 0 % test condition value.
D. BL: balance condition, IB: imbalance condition.
Waveforms
For all the waveforms in Figures 7-12, we use the following color definitions:
Cyan color waveforms denote R-phase voltages in volts (high magnitude) and current (low magnitude).
Dark Blue color waveforms denote Y-phase voltages in volts (high magnitude) and current (low magnitude).
Red color waveforms denote B-phase voltages in volts (high magnitude) and current (low magnitude).
CPRI uses the very intuitive and user-friendly DewesoftX data acquisition software. In combination with the power analysis module, the software makes grid measurements of this type accurate and easy.
The power analysis module is one of the most complex mathematical modules in DewesoftX. With various pre-installed wiring configurations, the software allows measurements of direct and alternating current grids operating at different and even variable frequency sources. All the measurements are synchronous.
The pre-installed wiring schematics available in the DewesoftX power analysis module are as follows:
DC
Single-phase
3-Phase Star
3-Phase Delta
3-Phase Aron
3-Phase V
3-Phase 2-meter
The Transducer Electronic Data Sheet (TEDS) concept eliminates setting issues by equipping each sensor with a small chip containing information about the sensor and the related amplifier settings.
The IEEE 1451 standard defines TEDS formats. Many sensor manufacturers have implemented this standard in their sensors - buy a sensor with such a chip, connect it, and everything is set.
Originally, TEDS capability was for piezoelectric sensors such as accelerometers and pressure sensors. Today, it includes all common analog sensors and actuators, such as MEMS (micro-electromechanical sensors), accelerometers, load cells, voltage output sensors, and more.
The operator doesn’t need to go through the setup and configuration steps. All the information is already in the chip - type of device, manufacturer, model number, serial number, calibration date, sensitivity, reference frequency, and amplifier setup. The TEDS also stores a table or algorithm of the transducer's calibration coefficients and frequency response.
A simple way to measure the disconnection time is to put the two L1 and L2 cursors. The difference between cursors gives the dt Delta T, i.e., disconnection time.
Out of the three phases of disconnection times of line currents, the longest time of zero current situation is considered for measurement from the time of disconnect from the start of de-energization of grid power - trigger signal indication in pink.
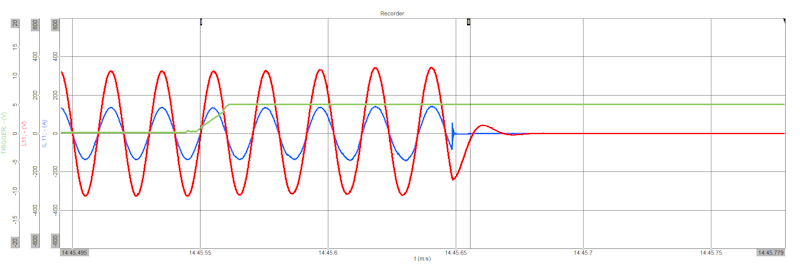
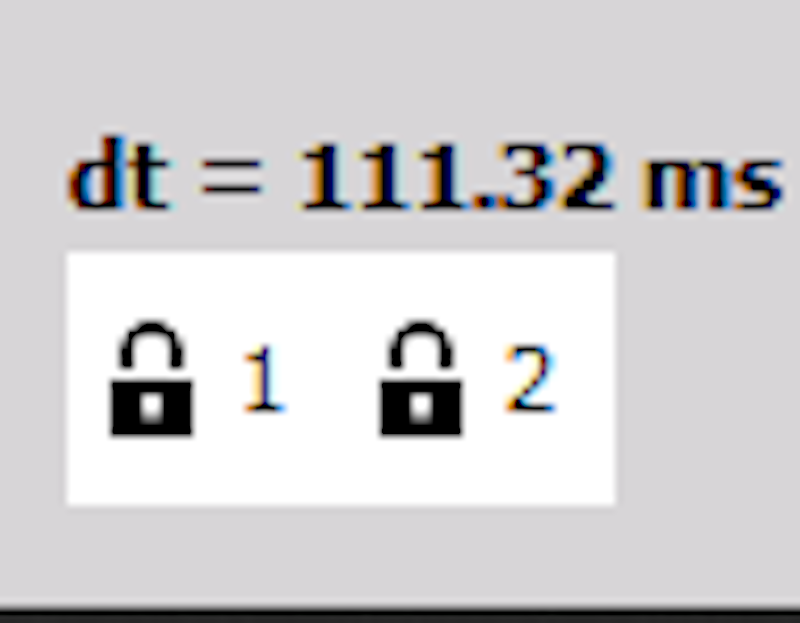
Manual placement of cursors will often induce human errors, as the event happens in milliseconds. These errors influence the overall performance of the inverter, which may fail the test and certification.
An EUT complies with the requirements for islanding protection when each case of recorded run-on time is less than 2s or meets the requirements of local codes.
| Test Condition | EUT output power (PEUT) | EUT input voltage (3) | EUT trip setting |
|---|---|---|---|
| A | Maximum (1) | >75% of the rated input voltage range | Manufacturer-specified voltage and frequent trip settings |
| B | 50% - 66% of Maximum | 50% of the rated input voltage range,±10% | Set voltages and frequency trip settings to nominal values |
| C | 25% - 33% (2) Maximum | <20% of rated input voltage range | Set voltage and frequency trip settings to nominal values |
Notes:
Achieve maximum EUT output power condition using the maximum allowable input power. Actual output power may exceed the nominal rated output.
Alternatively, the minimum allowable EUT output level, if exceeding 33%.
Based on EUT-rated input operating range. For example, 90% of the range =X + 0.75 * (Y-X) if the range is between X and Y volts. Y shall not exceed 0.8 * EUT Maximum system voltage, i.e., Maximum allowable array open circuit voltage. In any case, do not operate the EUT outside its permitted input voltage range.
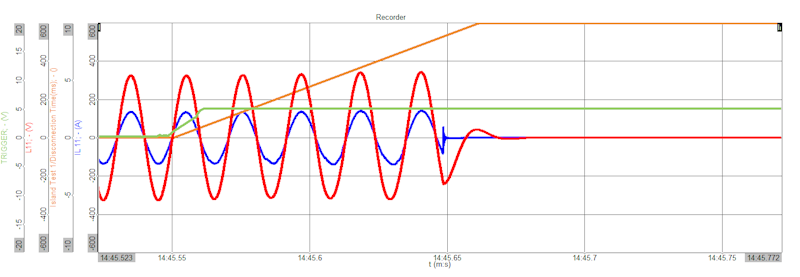
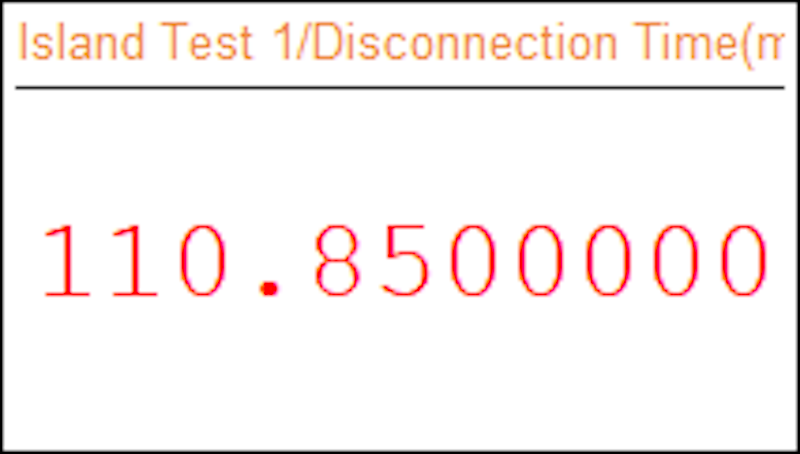
Dewesoft C++ Script is Dewesoft's tool for creating custom math modules. As a compromise between the formula's simplicity and a plugin’s power, the script enables you to write complex Dewesoft math modules. Using the C++ Script, we automated the complete test as part of the Dewesoft Math module, containing signal processing and analysis tools.
Now, the operator only needs to feed the input, such as current, trigger, and statistics channels of the Current RMS, into the island test setup. When running the test, the disconnection time appears immediately as the current reaches Zero.
Conclusion
In the event of a grid outage, inverters timely disconnecting from the grid prevents the creation of unintended isolated power islands. Rapid disconnection reduces the risk of electrical hazards for maintenance personnel and protects against potential damage to the inverter or connected equipment. Understanding and optimizing the islanding disconnection time for inverters contribute to a safer, more reliable, and compliant operation within the larger electrical grid.
Saving time is also crucial in a measurement environment. In simple words, ‘Time is Money.’ CPRI is happy with the Dewesoft hardware and software. The Dewesoft solution saves time on the disconnection time measurement and also increases safety. The results are even more accurate when done without any manual intervention. Happy Faces!!