




Battery Short-Circuit Test: Measuring 7.8 kA Peak Current and I²t
Christian Messner
Austrian Institute of Technology GmbH
October 23, 2026
Understanding how battery modules behave under extreme fault conditions is critical to designing safe and reliable energy storage systems. The AIT Austrian Institute of Technology performed a short-circuit test on a high-current battery module with an expected current of up to 10 kA, highlighting both the measurement techniques and the required safety precautions. Key insights from the test include the effects of internal resistance and inductance on current dynamics, as well as the evaluation of I²t for thermal and protective device stress assessment.
Why battery modules are short-circuit tested
A battery module short-circuit test answers a questions no datasheet can:
how much current does a module actually deliver when its terminals are bridged by a near-zero-resistance path,
how fast does that current arrive, and
how much energy does the fault dump into the surrounding hardware before protection can clear it?
At the AIT Austrian Institute of Technology, we short-circuited a 28.9 V battery module expected to deliver up to 10 kA, and measured a peak of 7,801 A reached in 7.5 ms.
A short circuit occurs when current flows along an unintended, low-resistance path that bypasses the normal load. A battery has no current limit of its own beyond its internal resistance, so that path can produce a surge of thousands of amperes within milliseconds — enough to melt conductors, deform busbars, trigger thermal runaway, or start a fire.
Designing against that outcome requires two numbers: the peak fault current the module can source, and the I²t — ampere-squared seconds, often written I2t — that the fault delivers before it is interrupted. Both have to be measured. Neither can be reliably predicted from a datasheet.
Inside the AIT SmartEST battery testing laboratory
The AIT Austrian Institute of Technology is Austria's largest non-university research and technology organization. It conducts applied research and develops technological solutions across digitalization, sustainability, security, energy, and mobility. The institute develops, researches, and tests technological solutions for customers in numerous laboratories.
In the SmartEST Laboratory, one of the most modern research and testing facilities for intelligent energy systems and smart grids, photovoltaic inverters, battery storage systems, and electric vehicle charging stations are tested and researched to assess performance, interoperability, and grid compliance.
A 1 MW connection capacity, along with corresponding DC and AC emulators and RLC loads, is available for this purpose. To simulate different environmental influences and their effects, the laboratory can vary ambient temperature and humidity in a climate chamber using state-of-the-art measurement technology.
Activities related to battery storage systems range from characterizing battery cells and modules to measuring the performance of commercial and industrial, as well as large-scale stationary storage systems, within the framework of acceptance tests in the laboratory and in the field.
The testing includes efficiency measurements of the overall system and its subsystems – the power conversion system and the battery – as well as measurements of control speed and accuracy. Further tests include verifying safety aspects, such as during a thermal runaway or a short circuit.
What is a battery short-circuit test?
A short-circuit test connects the battery terminals via a very low-resistance path to observe the battery's dynamic response under fault conditions. The current should rise rapidly to a peak value and then decrease, limited primarily by the battery’s internal resistance (Ri) and inductance (Li). The test also accounts for external circuit resistance, battery chemistry effects, and connection geometry.
Test objectives: peak current, di/dt and I²t
Measure the transient current response (di/dt) and peak short-circuit current.
Calculate I²t (Ampere-squared seconds) to assess thermal and protection stresses.
Evaluate how internal and external circuit parameters influence short-circuit behavior.
What determines a battery’s short-circuit current?
We can model the battery module as a series connection of an open-circuit voltage source (Voc), internal resistance (Ri), and internal inductance (Li). The short-circuit current is governed by:
Internal Resistance (Ri): Limits the maximum steady-state current, Isc≈VocRiI_{sc} \approx \frac{V_{oc}}{R_i}Isc≈RiVoc.
Internal Inductance (Li): Slows the current rise, defining the transient slope didt\frac{di}{dt}dtdi.
External Circuit Resistance/Inductance: Includes test cables, busbars, and switching elements.
Battery Chemistry: Voltage collapse under extreme load further reduces current over time.
Key Takeaway: Ri sets the current magnitude, while Li controls the rise time. Both are critical to safe design and accurate measurement interpretation.


Challenges of short-circuit testing at 10 kA
Short-circuit testing at 10 kA presents several technical and safety challenges:
Safety Risks: Electromagnetic forces, arc flash, and thermal hazards; risk of thermal runaway or fire.
Measurement Accuracy: High di/dt requires low-inductance shunts and high-speed acquisition systems.
Switching Equipment: Components must safely withstand and interrupt peak currents.
Reproducibility: Variations in cable inductance or connection resistance affect results.
Battery Stress: Accelerated aging or thermal runaway necessitates strict control.
Short-circuit test setup
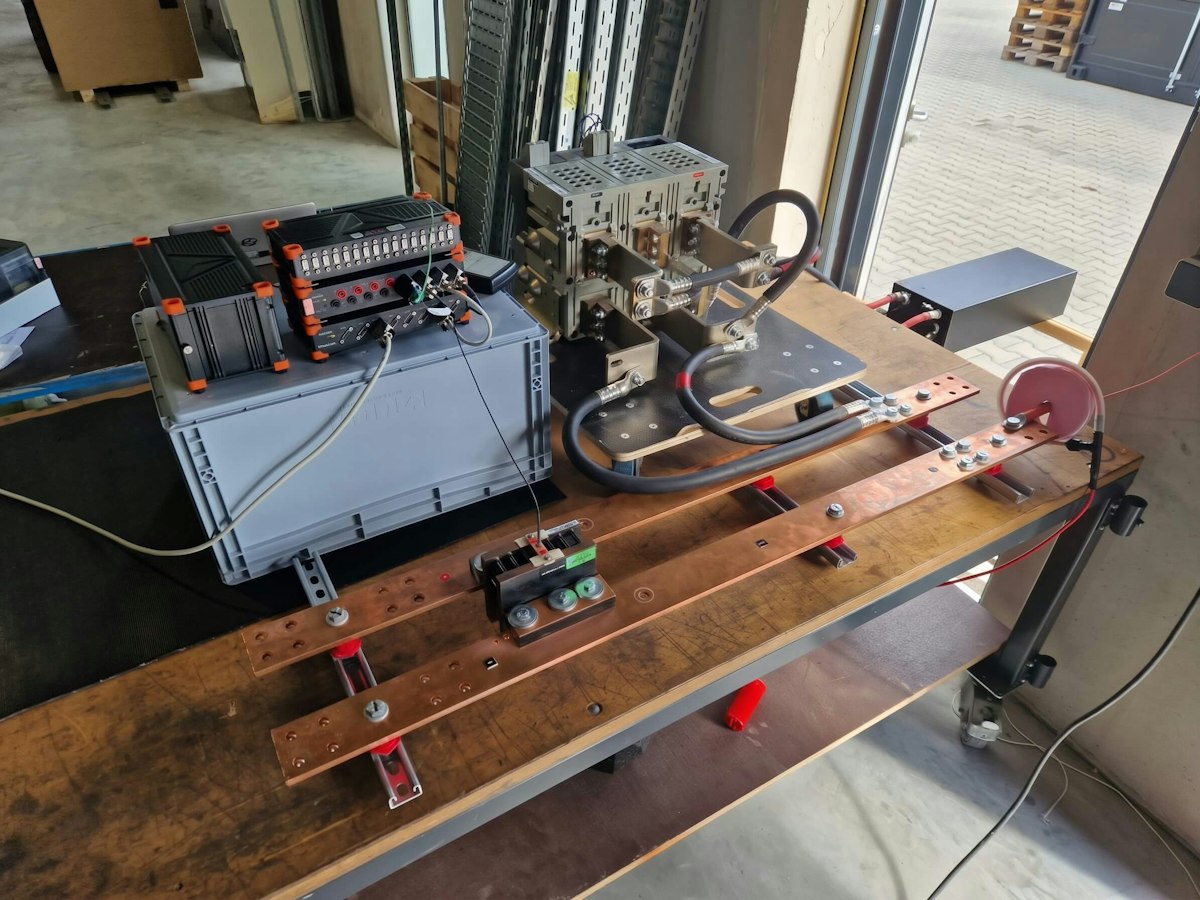
Measurement equipment — shunt, Rogowski coil and DAQ
Dewesoft SIRIUS HS: A versatile and powerful modular data acquisition system that offers high-end signal-conditioning amplifiers and high-speed data acquisition, isolated to reduce grounding loops.
Dewesoft Battery Pack: Dewesoft battery packs - DS-BP2i and DS-BP4i work with SIRIUS data acquisition systems.
High-Current Switch: Remote-controlled, rated for kA currents.
Shunt: Low-resistance (12 μΩ) and low-inductance shunt for accurate high-current measurements. Output voltage:
Rogowski Coil: Non-intrusive measurement of di/dt with electronic integration to recover I(t). Advantages: wide bandwidth, no voltage drop; limitation: no DC measurement.


The battery module under test
The device under test is a single-battery module, and we measured AC resistance at 1 kHz (HIOKI BT3562A) to estimate the maximum current.


Safety measures for high-current battery testing
Handling fault currents in the 10 kA range involves enormous electromagnetic forces, arc flashes, and thermal hazards. If the short circuit lasts too long, the battery cells may enter thermal runaway, and the battery module may catch fire.
We applied these safety measures:
Thermocouple and infrared monitoring.
Water tank ready for thermal runaway scenarios.
Remote switching and insulated measurement system.
Short-circuit test procedure, step by step
Record the current after the short circuit. The current rises rapidly to its maximum, then decreases again. I determine the current's rise time and amplitude.
Integrating the square of the current over time provides I²t (Ampere-squared seconds). Engineers use this parameter for:
Quantifying the energy dissipated in the system during the fault.
Assessing thermal stress on protective devices (fuses, circuit breakers) and components.
Comparing short-circuit stresses against design limits.
High I²t values indicate significant heating and an increased risk of damage. Manufacturers rate protection systems by the maximum I²t they can withstand.
In testing, we followed this 6-step procedure:
1) Estimate Maximum Current: AC resistance measurement to predict peak short-circuit current.
2) Pre-Test Verification: Apply 75 A DC to validate measurement sensors
3) External Circuit Resistance Measurement:
4) Short-Circuit Test:
Switch on for 2.5–5 s.
Record current with a shunt and Rogowski coil.
Switch off and allow cooling.
5) Temperature Monitoring: Confirm that the battery remains within the safe operating range.
How I²t is calculated and what it tells you
I²t — ampere-squared seconds, also written I2t or called the Joule integral — is the integral of the squared current over the duration of the fault:
I²t = ∫<sub>0</sub><sup>T</sup> i(t)² dt
Because resistive heating is proportional to the square of current, I²t is proportional to the thermal energy a fault deposits in a conductor, a contact or a protective device. It is the quantity that decides whether something survives the event — and it is why a 10 kA fault lasting 5 ms can be less damaging than a 3 kA fault lasting 100 ms.
Engineers use I²t in three ways:
Quantifying the energy dissipated in the system during the fault.
Assessing thermal stress on protective devices. Fuses and circuit breakers are rated by the maximum I²t they can withstand and the maximum they let through while clearing.
Comparing measured short-circuit stress against design limits for busbars, connectors, contactors and cell interconnects.
Computing I²t requires the whole current waveform, not just the peak — which is why the fault is recorded at high sample rate rather than reduced to a single maximum reading.
Test results: 7.8 kA peak short-circuit current
The short-circuit tests characterize the battery modules' dynamic response by peak current, time to peak, and the resulting (I^2t) value. A high peak current causes significant electromagnetic and mechanical stresses, while the (I^2t) value represents the thermal energy introduced during the short-circuit event.
Short-circuit Tests
| Parameters | Test 1 | Test 2 |
|---|---|---|
| Peak current | 7339 A | 7801 A |
| Time until peak | 5.8 ms | 7.5 ms |
Figure 4 shows different time scales: the left-hand plot shows current development over the first 2 s, whereas the right-hand plot focuses on the rapid increase in (I^2t) during the first 20 ms. This shorter time scale highlights the very rapid increase in (I^2t) immediately after the short circuit occurs, which would be difficult to distinguish in a plot covering the full two-second period.


No fuse was installed during the tests, and the short circuit was manually interrupted with a controlled circuit breaker. Nevertheless, the measured peak currents and (I^2t) values provide useful input for selecting and sizing suitable fuses or other protective devices. In particular, they can be compared with the breaking capacity, time-current characteristic, and pre-arcing or total clearing (I^2t) values specified by the protection-device manufacturer.


Expected vs. measured — why the current stayed below 10 kA
The module was expected to deliver up to 10 kA. It delivered 7,339 A in the first run and 7,801 A in the second. That gap is not measurement error — it is the difference between a prediction made from an AC resistance measurement and the behaviour of a real circuit under a real fault. It is worth unpacking, because the same gap will appear in anyone else's test.
Working backwards from the measured peaks gives the effective circuit resistance:
| Specification | Test 1 | Test 2 |
|---|---|---|
| Peak current | 7,339 A | 7,801 A |
| Implied total circuit resistance (28.9 V ÷ I<sub>peak</sub>) | 3.94 mΩ | 3.70 mΩ |
| Measured external circuit resistance | 0.66 mΩ | 0.66 mΩ |
| Implied module resistance under fault | 3.28 mΩ | 3.04 mΩ |
Reaching 10 kA from 28.9 V would require a total circuit resistance of 2.89 mΩ — roughly 0.8 to 1.0 mΩ less than the circuit actually presented. Four effects account for the difference.
AC resistance underestimates DC fault behaviour. The pre-test estimate came from an AC resistance measurement at 1 kHz. At that frequency the measurement captures mainly the ohmic and electrolyte contributions and largely excludes charge-transfer and diffusion resistance, which develop over the millisecond-to-second timescale of an actual short circuit. AC internal resistance is therefore systematically lower than the DC internal resistance that governs a sustained fault.
The external circuit is not negligible. At 0.66 mΩ, the cables, busbars, bolted joints and high-current switch contributed roughly 17 % of the total circuit resistance. A prediction based on the module alone will always be optimistic.
Terminal voltage sags under load. 28.9 V is the rest voltage. Under a multi-kiloampere load, polarisation reduces the driving voltage further, and the current decays throughout the test — from about 7.3 kA to 4.0 kA over 2.3 s in the first run.
Contact and joint resistance varies between runs. The 0.24 mΩ difference between the two tests is itself informative, and points to a temperature effect discussed below.
The practical conclusion: a short-circuit current predicted from an AC resistance measurement should be treated as an upper bound for safety planning — size the test rig, the switchgear and the safety envelope for it — but not as a value that will be observed. Only a measured test gives the number that belongs in a protection calculation.
What the two test runs reveal
Two runs on the same module, a few minutes apart, produced measurably different results — and the difference is the most instructive part of the dataset.
The second run reached a higher peak: 7,801 A against 7,339 A, an increase of about 6 %. This runs counter to intuition for anyone used to metallic conductors, where resistance rises with temperature. In a lithium-ion cell the dominant temperature effect is the opposite — warming improves ionic conductivity in the electrolyte and lowers charge-transfer resistance, so internal resistance falls. The first short circuit heated the module; the second therefore met a lower resistance and produced more current. The implied module resistance dropped from 3.28 mΩ to 3.04 mΩ between runs.
The second run also took longer to peak: 7.5 ms against 5.8 ms. With loop inductance essentially unchanged between runs, lower circuit resistance lengthens the L/R time constant, so the current takes longer to settle even though it settles higher.
For test planning, this means a module's short-circuit behaviour is not a single number. State of charge, temperature and test history all move it, so a characterisation campaign should record them alongside the current trace — and a worst-case design figure should come from a warm module, not a cold one.
For protection design, the I²t curves rise steeply over the first few hundred milliseconds and then flatten as the current decays. Most of the thermal stress arrives early, which is precisely why clearing time matters more than peak current alone.
Using I²t results to select fuses and protective devices
No fuse was installed during these tests. The short circuit was interrupted manually with a controlled circuit breaker after about 2.3 s — far longer than any protective device would permit in service. That makes the measured I²t a deliberate worst case, and a useful one: it defines the upper bound a protection scheme has to be designed against.
By the end of each run the fault had delivered approximately 7.1 × 10⁷ A²s in Test 1 and 7.6 × 10⁷ A²s in Test 2.
These figures feed into protective device selection in three ways.
Breaking capacity. The device has to interrupt the measured peak current — here 7.8 kA at 28.9 V DC — without failing. DC breaking is considerably harder than AC, because there is no natural current zero to assist arc extinction, so the DC-rated breaking capacity is the figure that matters, not an AC rating.
Time-current characteristic. The measured rise time — peak at 5.8 ms and 7.5 ms — determines where on the device's time-current curve the fault lands. A device that clears in 2 ms never sees full current; one that clears in 50 ms sees all of it, plus the decay.
Pre-arcing and total clearing I²t. A fuse's pre-arcing I²t must sit below the withstand I²t of everything it protects, and its total clearing I²t defines the energy that still reaches the circuit. Comparing those catalogue values against the measured curve shows whether a candidate device actually protects the module's interconnects, busbars and connectors — or merely survives alongside them.
The same measured curve validates the cell interconnects and busbars themselves, which have their own I²t withstand limits and are often the weakest link in a module.
Battery short-circuit testing standards
The test described here was a characterisation test, not a certification test. It used a longer fault duration and a manually controlled interruption rather than the fixed procedure any single standard prescribes, because the objective was to measure the module's actual fault behaviour rather than demonstrate conformity. It is still worth knowing where external short-circuit testing sits in the standards landscape, because measured values of this kind feed into all of them.
| Standard | Scope | Short-circuit requirement |
|---|---|---|
| IEC 62619:2022 | Safety requirements for secondary lithium cells and batteries for industrial applications, including stationary storage | External short-circuit test; surface temperature must not exceed 150 °C, with no fire or explosion |
| IEC 62660-2:2018 | Reliability and abuse testing of lithium-ion cells for propulsion of electric road vehicles | External short-circuit test at cell level, among the abuse tests |
| IEC 62660-3 | Safety requirements for lithium-ion cells for electric road vehicle propulsion | Safety criteria applied to the abuse tests in Part 2 |
| UN 38.3, Test T5 | Transport of lithium cells and batteries | External short circuit through a low-resistance path at elevated temperature; no disassembly, rupture or fire within the observation period |
| UL 1973 | Batteries for stationary, vehicle auxiliary power and light electric rail applications | Short-circuit test at module and system level |
| ISO 6469-1 | Rechargeable energy storage systems in electrically propelled road vehicles | Safety requirements covering short-circuit protection of the RESS |
Across all of them the underlying question is the one this test answers: how much current does the module source, how quickly, and how much energy reaches the surrounding hardware before the fault is cleared.
Conclusion
Short-circuit testing a battery module at kiloampere levels comes down to two measurements and one integral: how high the current goes, how fast it gets there, and how much energy it delivers before it is cleared.
On this 28.9 V module, the answers were 7,801 A, 7.5 ms, and roughly 7.6 × 10⁷ A²s over a 2.3 s fault. Internal resistance set the magnitude and loop inductance set the rise time, with the external circuit contributing close to a fifth of the total resistance — enough to pull the measured current well below the 10 kA predicted from an AC resistance measurement.
That gap is the main takeaway for anyone planning a similar test. Predict conservatively, and build the rig, the switchgear and the safety envelope for the higher figure — but take the protection design from measured data. Doing that safely at these currents requires a low-inductance shunt and a Rogowski coil feeding a high-speed, isolated acquisition system, remote switching, and a worked-through thermal runaway plan.
The resulting dataset is worth more than a pass or fail. It validates battery models, sizes fuses and contactors, and gives interconnect and busbar design a measured stress figure rather than an assumed one.
Dewesoft's battery testing solutions cover short-circuit, performance, thermal and BMS testing with synchronised high-speed acquisition. The same AIT SmartEST laboratory also uses Dewesoft systems for climate chamber testing of DC fast chargers.