




Experimental Modal Testing of a Sounding Rocket for Structural Validation
Nerea Alvarez Fernandez
Technical University of Valencia
August 28, 2026
Structural dynamics validation is essential in sounding rocket development because the vehicle must withstand intense vibration during launch and flight. In this study, Faraday Rocketry performed experimental modal testing on a two-stage sounding rocket using DewesoftX for data acquisition and modal analysis. By comparing measured natural frequencies and mode shapes with finite-element model predictions, the team evaluated the structural model and demonstrated how real-time FRF analysis and modal parameter extraction can support aerospace structural validation.
Sounding rocket structural dynamics and modal testing
Sounding rockets must withstand severe vibration and dynamic loads during launch and flight. Understanding how the structure responds to these forces is therefore an important part of design validation and flight readiness.
Modal testing helps engineers identify key structural properties, including natural frequencies, mode shapes, and damping ratios. These parameters are used to assess structural integrity, identify potential resonance risks, and validate finite element models against the behavior of the physical structure.
Testing a sounding rocket also presents several practical challenges. The structure must be tested under representative boundary conditions, such as free-free suspension or ground-supported configurations, while maintaining accurate measurements across multiple points. Lightweight airframes, fins, and internal components can also produce complex dynamic responses that require precise frequency-domain analysis.
A typical modal test combines measurements from several accelerometers with a known excitation force. The resulting signals are used to calculate Frequency Response Functions (FRFs) and extract modal parameters. Comparing these experimental results with numerical simulations makes it possible to determine how accurately the finite element model represents the real structure.
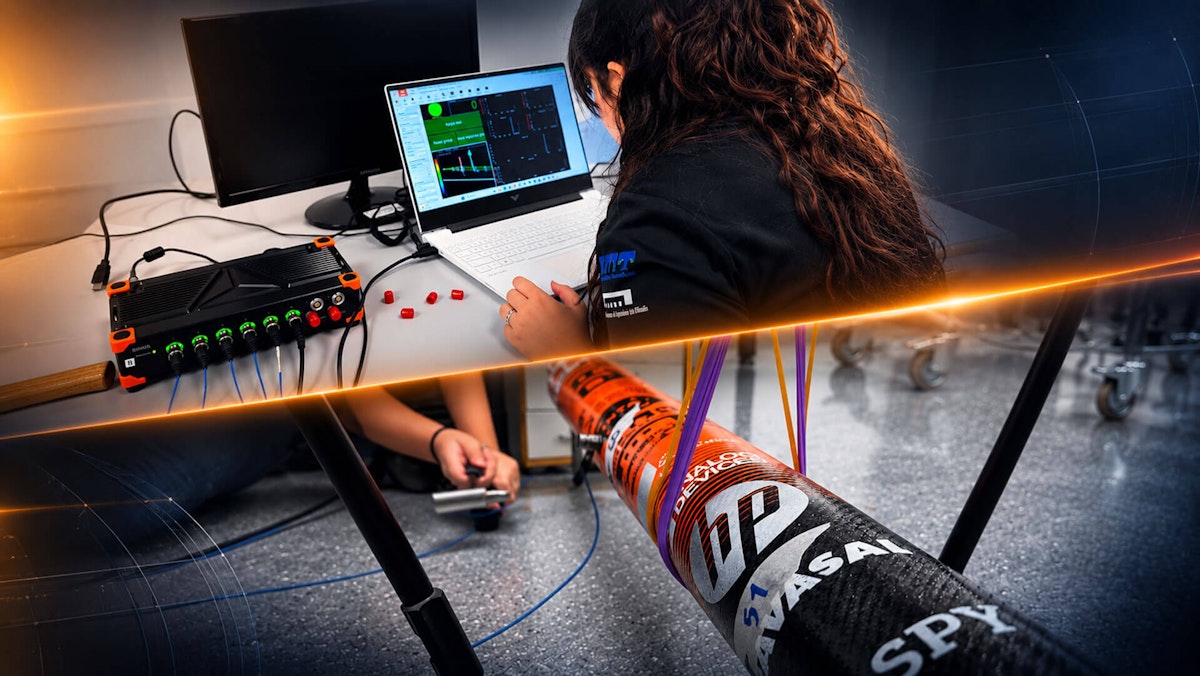
In this study, Faraday Rocketry used Dewesoft SIRIUS data acquisition hardware and DewesoftX software to perform experimental modal testing on a two-stage sounding rocket. The team configured the measurement system, accelerometers, impact hammer, and modal analysis tools to acquire and process the structural response.
The test results were then used to identify natural frequencies, mode shapes, and damping ratios and to compare the measured structural behavior with finite element model predictions.
Faraday Rocketry and the Origin sounding rocket
Faraday Rocketry UPV was founded in 2021 as the first university rocketry team at the Universitat Politècnica de València (UPV). Since then, the team has steadily advanced its sounding rocket development program.
In 2022, Faraday developed the Aspera and Astra rockets, with Astra competing in EuRoc, one of Europe’s leading university sounding rocket competitions. In 2023, the team returned with Genesis, which received the EuRoc Flight Award. Further progress followed in 2025 with Skybraker, the first Faraday rocket powered by a Student Researched and Developed (SRAD) motor. Skybraker also received the EuRoc Flight Award.
In 2026, the team developed Origin, a two-stage sounding rocket designed to exceed an apogee of 10 kilometers. After identifying issues during its initial launch attempt, Faraday prepared the vehicle for a second flight on May 29.


Reliable structural design is critical to the successful launch and flight of a sounding rocket. The airframe, fins, and internal components must respond predictably to dynamic excitation from sources such as motor vibration, aerodynamic buffeting, and flight control actuation.
Structural dynamics testing helps engineers determine whether the rocket’s natural frequencies remain sufficiently separated from these excitation sources and whether resonance could become a concern. Experimental modal testing also provides a way to compare the real structure with its finite element model by measuring natural frequencies, mode shapes, and damping ratios.
This comparison allows the team to identify discrepancies that may not be apparent in simulation alone and to refine the structural model before future flight campaigns. By combining numerical analysis with experimental measurements, Faraday can make better-informed decisions about structural integrity, dynamic loading, and overall flight readiness.
The structural validation challenge
A key challenge in sounding rocket development is that the exact vibrational environment during flight cannot be fully known before launch. Engineers can estimate the main excitation sources, but simulations alone cannot predict the structure’s real dynamic response with complete certainty.
For Faraday Rocketry UPV, dedicated flight campaigns are also not a practical way to characterize structural dynamics because of their cost. This makes ground-based experimental testing an important step in validating the rocket before flight.
The goal of the modal test was therefore to compare the rocket’s measured dynamic behavior with predictions from its finite element model. In particular, the team compared natural frequencies and mode shapes to determine whether the numerical model accurately represented the physical structure.
Using Dewesoft hardware and software, Faraday carried out an experimental modal testing campaign to collect the dynamic data needed for FEM correlation, structural assessment, and future design decisions.
Experimental modal analysis fundamentals
Natural frequencies, mode shapes, and damping
Modal analysis is an experimental technique used to identify the dynamic properties of a structure:
natural frequencies (fn),
mode shapes (ϕn), and
modal damping ratios (ζn).
These parameters characterize how the structure vibrates under external excitation and are essential for validating finite element models and ensuring structural integrity under dynamic loading.
The relationship between the applied force F (ω) and the structural response X(ω) in the frequency domain is described by the Frequency Response Function (FRF):
Each natural frequency corresponds to a resonance peak in the FRF, and the width of the peak is related to the modal damping. By measuring the FRF experimentally and fitting mathematical models to the resonance peaks, we can extract the modal parameters.
Impact hammer modal testing method
Experimental modal testing combines a known excitation force with measurements of the structure’s vibration response. In an impact hammer test, an instrumented hammer applies a controlled impulse to the structure. A force transducer built into the hammer measures the input force, while the impact provides broadband excitation across the frequency range of interest.
Accelerometers positioned at selected points on the structure measure the resulting vibration response. The measured force and acceleration signals are then processed to calculate the Frequency Response Function (FRF), which describes how the structure responds to excitation at different frequencies.
FRF measurement quality is evaluated using the coherence function, γ²(ω), with values ranging from 0 to 1. Values close to 1 indicate a strong relationship between the measured input and response, while values below 0.9 can indicate measurement noise, insufficient excitation, or nonlinear structural behavior.
Free-free boundary conditions for sounding rocket testing
For sounding rocket modal testing, a free-free configuration closely represents the vehicle’s structural behavior during flight, when it is not mechanically constrained by external supports. To reproduce these conditions on the ground, the rocket is suspended using soft elastic cords that provide minimal restraint and reduce the influence of the support system on the measured structural response.
Under ideal free-free conditions, the structure has six rigid-body modes near zero frequency, corresponding to translational and rotational motion without structural deformation. These modes are separated from the elastic structural modes that are relevant to the modal analysis.
The first structural bending mode is typically the lowest nonzero-frequency mode and is therefore an important parameter for comparison with finite element model predictions. Keeping the suspension-system frequencies well below this first bending mode helps ensure that the measured response represents the rocket structure rather than the test support.
Sounding rocket modal test setup
Experimental modal test procedure
The objective of the modal test was to validate the finite element model by measuring the rocket’s natural frequencies and mode shapes under free-free boundary conditions. The test procedure consisted of four main steps:
Suspend the rocket in a free-free configuration. Soft elastic cords supported the structure while minimizing external constraints. The suspension system was designed so that its own modes remained well below the first structural bending mode.
Define the measurement grid. Excitation points were marked along the airframe to provide sufficient spatial resolution for reconstructing the expected mode shapes.
Instrument the structure with accelerometers. Four accelerometers were positioned along the rocket’s longitudinal axis at locations selected to capture the bending modes predicted by the finite element model.
Configure the data acquisition and modal analysis system. Dewesoft SIRIUS recorded the impact force and acceleration signals simultaneously, while DewesoftX calculated Frequency Response Functions (FRFs) in real time and supported modal parameter extraction.
The test was performed indoors to reduce the influence of ambient vibration and environmental noise. The rocket was suspended horizontally at two points using soft elastic cords attached to an overhead support. These suspension points were positioned approximately near the nodal lines of the first bending mode to reduce interaction between suspension dynamics and the rocket’s structural modes.
Excitation points were distributed at regular intervals along the airframe so that the expected mode shapes could be adequately excited. At each point, the structure was struck with an instrumented impact hammer in the radial direction, perpendicular to the rocket’s longitudinal axis.
Multiple impacts were performed at each excitation point. Averaging these measurements improved repeatability and increased the signal-to-noise ratio of the resulting FRFs.
Modal testing equipment and instrumentation
The modal test setup consisted of the following hardware components:
Dewesoft SIRIUS Data Acquisition System
Dewesoft SIRIUS modular data acquisition system. The Sirius module served as the core of the acquisition system. It processed the sensor signals and transferred the data to a laptop computer running DewesoftX software. The SIRIUS system provides high-resolution analog-to-digital conversion (24-bit), built-in IEPE excitation for piezoelectric sensors, and a modular architecture that allows easy expansion with additional input channels if needed.
Impact Hammer and Accelerometer Setup
PCB Piezotronics 086C03 ICP piezoelectric force sensor. We used this instrumented hammer to apply controlled impacts to the structure. The hammer has a built-in force transducer that measures the applied impulse force. The sensor has a measurement range suitable for lightweight aerospace structures and provides a broadband excitation with sufficient energy content in the frequency range of interest (0–200 Hz).
Four uniaxial IEPE accelerometers. These accelerometers were distributed along the rocket airframe to measure the lateral vibration response at multiple points. The accelerometers were oriented to measure radial acceleration (Z-axis), perpendicular to the rocket's longitudinal axis, as this is the direction in which bending modes exhibit the greatest displacement. The sensors were bonded to the external surface of the structure with adhesive mounting pads to ensure reliable mechanical coupling without altering the test article's dynamic properties.
Free-Free Rocket Suspension System
Elastic suspension cords. We used soft elastic cords to suspend the rocket in a free-free configuration. The cords were selected to have low stiffness, ensuring that the suspension modes occur at frequencies well below the first structural mode (typically below 2–3 Hz). Two suspension points, positioned near the center of mass and at an additional point toward the nose, ensured stable horizontal suspension without introducing significant constraint forces.


Modal analysis with DewesoftX software
We performed the data acquisition, signal processing, and modal analysis using DewesoftX. This comprehensive data acquisition and signal processing software platform provides a complete integrated environment for modal testing, including:
Real-time FRF computation using the H1 estimator, which minimizes the effect of noise in the acceleration measurement.
Coherence function calculation to assess the quality of each FRF measurement.
Automated multi-point measurement workflows, allowing sequential acquisition at all excitation points with minimal user intervention.
Modal parameter extraction tools, including peak-picking algorithms for natural frequency identification and curve-fitting methods for damping estimation.
3D geometry definition and mode shape visualization, enabling direct comparison between experimental mode shapes and finite element predictions.


The software was configured with a sampling rate of 1024 Hz, providing adequate frequency resolution and anti-aliasing protection for the frequency range of interest (0–250 Hz). We recorded each impact over a 2-second time window and computed the FRF using a frequency resolution of 0.5 Hz. We did four impacts at each excitation point, and averaged the FRFs to reduce random noise and improve measurement consistency.
We then exported the measured natural frequencies and mode shapes to correlate them with the finite element model results.
DewesoftX modal test configuration
The software setup was as follows:


Force and acceleration measurement channels
AI 1, AI 2, AI 3, and AI 4: Here is where the IEPE accelerometers are connected.
AI 5: This input is the normal axis of a triaxial accelerometer; however, we did not use this in the study of the whole rocket.
AI 6: Here is where the impact hammer is connected.
Experimental modal analysis results
Modal identification using the stabilization diagram
The experimental modal analysis was conducted over the frequency range 0-150 Hz using a maximum model order of 20. The stabilization diagram successfully identified 16 computational modes, which we filtered based on damping ratio and modal stability criteria to distinguish genuine structural modes from suspension-related dynamics and spurious computational artifacts.


Figure 5 shows the stabilization diagram with identified modal parameters. The vertical alignment of stable poles (green circles) indicates well-identified modes, while scattered poles represent computational artifacts or poorly excited modes.
Identified natural frequencies and modal parameters
Table 1 presents all 16 identified modes with their corresponding frequencies, damping ratios, and MCF values. The modes were classified based on their damping characteristics and physical interpretation.
Suspension and rigid-body modes
Modes 1 and 2 (17.98 Hz and 19.76 Hz) exhibited extremely high damping ratios exceeding 25%, characteristic of rigid-body motion associated with the elastic suspension system. These modes represent pendulum-like swaying and bouncing motion of the suspended rocket rather than structural deformation, and we excluded these from FEM correlation.
First and second structural bending modes
We identified Mode 3 at 29.08 Hz with 1.90% damping as the first lateral bending mode. The low damping ratio is consistent with elastic structural deformation, distinguishing it from suspension-related dynamics. Mode 11 at 96.67 Hz with 5.08% damping corresponds to the second lateral bending mode. Although the damping is moderately higher than that of typical metallic structures (2–3%), the frequency location and mode-shape characteristics confirm its structural nature.
| Mode | Frequency (Hz) | Damping (%) | MCF (%) | Classification |
|---|---|---|---|---|
| 1 | 17.98 | 32.50 | 0.00 | Suspension mode |
| 2 | 19.76 | 25.27 | 0.01 | Suspension mode |
| 3 | 29.08 | 1.90 | 0.37 | 1st bending |
| 4 | 39.53 | 14.45 | 0.00 | Local/spurious |
| 5 | 56.36 | 12.38 | 0.01 | Local/spurious |
| 6 | 56.37 | 13.07 | 0.01 | Local/spurious |
| 7 | 56.46 | 13.47 | 0.01 | Local/spurious |
| 8 | 70.54 | 6.79 | 0.01 | Possible local mode |
| 9 | 70.87 | 7.60 | 0.01 | Possible local mode |
| 10 | 70.88 | 6.92 | 0.01 | Possible local mode |
| 11 | 96.67 | 5.08 | 0.01 | 2nd bending |
| 12 | 97.15 | 5.26 | 0.01 | 2nd bending (duplicate) |
| 13 | 110.00 | 3.06 | 0.01 | Higher-order structural |
| 14 | 110.22 | 2.79 | 0.01 | Higher-order structural |
| 15 | 122.20 | 3.53 | 0.00 | Higher-order structural |
| 16 | 122.36 | 2.95 | 0.00 | Higher-order structural |
Local and spurious vibration modes
Modes 4–7 (39–56 Hz) exhibited high damping ratios (12–14%) and clustered frequencies, suggesting these are either computational artifacts from the identification algorithm or localized vibrations of individual components (fins, nosecone, or fasteners) rather than global structural modes. Modes 8–10, clustered around 70 Hz with moderate damping (6–7%), may represent local panel or component vibrations.
Higher-order rocket structural modes
Modes 13–16 (110–122 Hz) showed low damping ratios (2.8–3.5%), indicating genuine structural modes. These likely correspond to third-order bending or torsional modes not computed in the initial FEM analysis. Their identification demonstrates the value of experimental testing in revealing dynamics beyond the scope of limited numerical models.


Figure 6 displays the measured FRFs for all active measurement channels. The magnitude plots clearly show resonance peaks at the identified natural frequencies, with the first-mode peak at approximately 20-30 Hz and the second-mode peak near 97 Hz. The phase plots exhibit the characteristic 180-degree phase shift across resonance peaks, confirming the quality of mode identification.
Experimental modal test and FEM correlation
We correlated the experimental natural frequencies with our finite element model predictions for the two-stage configuration under free-free boundary conditions. Table 2 presents the comparison for the first two bending modes.
| Mode | Description | FEM (Hz) | Experimental (Hz) | Error (%) | Status |
|---|---|---|---|---|---|
| 1 | 1st lateral bending | 27.32 | 29.08 | +6.4 | Validated |
| 2 | 2nd lateral bending | 92.57 | 96.67 | +4.4 | Validated |
The first bending-mode correlation shows a 6.4% error, which is acceptable given the experimental uncertainties inherent in low-frequency modal testing below 50 Hz. These uncertainties include contamination from suspension-system dynamics, the limited energy content of the impact hammer at low frequencies, ambient vibration noise, and frequency-resolution limitations.
The second bending mode shows an excellent correlation with a 4.4% error, validating the FEM model’s stiffness and mass distribution in the mid-frequency range, where experimental measurement quality is higher. This agreement confirms that the finite element model accurately represents the global structural dynamics of the two-stage rocket configuration.


Modal measurement quality and limitations
All identified modes exhibited extremely low Modal Confidence Factor (MCF) values, below 1%, indicating poor mode-shape quality. We attribute this limitation to:
Limited number of active FRFs due to software licensing restrictions (approximately 12 of 24 total measurement points)
Insufficient spatial resolution of accelerometer placement for complete mode shape reconstruction
Impact hammer excitation limitations, particularly at low frequencies
Despite low MCF values that affected mode-shape quality, the natural-frequency identification remained reliable, as evidenced by the strong FEM correlation. The frequency-domain measurements showed clear resonance peaks with well-defined phase characteristics, providing confidence in the extracted natural frequencies despite limited spatial mode-shape information.
Structural validation results and conclusions
The experimental results successfully validated the FEM model for the two critical bending modes within the 0–100 Hz frequency range. The errors of 6.4% and 4.4% are well within industry-standard tolerances for aerospace structures (typically < 10% for modal testing). These results confirm that:
The FEM model accurately captures the global stiffness and mass distribution of the physical structure
Material properties and boundary condition assumptions in the FEM are representative of reality
Faraday Rocketry can confidently use the model for dynamic load analysis, flutter assessment, and flight control system design.
The identification of higher-order modes at 110–122 Hz, not predicted by the initial two-mode FEM analysis, highlights the value of experimental testing in uncovering structural dynamics beyond the limitations of limited computational models. Future FEM analyses should extend the frequency range to capture these additional modes for complete structural characterization.
The challenges encountered with low-frequency testing (suspension contamination, poor hammer excitation) and limited mode-shape quality (low MCF) are typical of impact-hammer modal testing on large, lightweight aerospace structures. We can address these limitations in future test campaigns through improved instrumentation (shaker excitation, additional accelerometers) and controlled testing environments.