




Machine Learning for Early Hydro-Generator Fault Detection
Hossein Foroozan, Ozren Orešković, Božidar Filipović-Grčić, Ivan Krnić, Ivan Kolić, and Nikola Mijalić
Veski d.o.o, University of Zagreb and HEP d.d.
May 25, 2026
Hydropower plants are long-lived assets whose aging hydro-generators demand more than conventional threshold-based alarms to ensure reliable, uninterrupted operation. In collaboration, Veski d.o.o., the University of Zagreb, and HEP d.d. present a machine–learning–based add-on that learns a unit’s normal behavior and detects subtle deviations in real time. Implemented at a Croatian hydropower plant, the system demonstrates how residual-based prediction of vibration signals can provide weeks of early warning before conventional alarms are triggered.
Hydropower is a major source of clean energy worldwide, with aging fleets in which many plants are several decades old, underscoring the importance of reliable condition monitoring. Early fault detection is essential for reducing downtime and avoiding costly unplanned outages, making advanced monitoring and maintenance strategies a practical necessity.
Hrvatska Elektroprivreda (HEP Group) is the Croatian national energy company, which has been dealing with the generation, distribution, and supply of electricity for more than a century. And in the last few decades, it has been dealing with the distribution and supply of heat energy and natural gas to customers.
The University of Zagreb is a public research university, the largest Croatian university, and one of the oldest continuously operating universities in Europe. Its Faculty of Electrical Engineering and Computing (FER) is a leading institution in education, research, and innovations in electrical engineering, ICT, and computing. The faculty engages 3800 undergraduate and graduate students, 450 PhD students, 200 professors, and 300 teaching and research assistants. FER works closely with industry to turn technological advancements into real-world solutions.
Veski d.o.o. is one of the leading regional companies with more than 30 years of experience in vibration measurements and diagnostics, and online Machine Condition Monitoring for turbo and hydro generators and HV motors. Today, the company is a member of the Dewesoft group.
In this case, we present an enhanced monitoring approach implemented on a hydrogenerator unit in Croatia. The proposed solution extends the existing monitoring and diagnostic system by incorporating a machine learning (ML) and deep learning module as an add-on. Rather than relying solely on fixed alarm thresholds, the ML module learns the hydro-generator's normal operating behavior from historical data.
Based on current operating conditions—such as active and reactive power, temperature, rotational speed, water flow, and pressure—it continuously predicts the expected values of key condition indicators, in this case study, primarily vibration-related signals. The difference between predicted and measured values, known as the residual, is a sensitive indicator of behavioral deviation. Residuals are categorized into five warning levels and displayed in a dashboard, enabling users to identify gradual departures from normal operation at an early stage.
To develop the system, domain experts first selected a representative period of normal operation. Correlations between input and output signals were then analyzed to determine the most relevant variables, followed by model training and validation using additional datasets. We implemented the approach at a hydropower plant in Croatia, where we are evaluating the effectiveness of early fault detection and behavioral deviation monitoring under real operating conditions.
Background
Hydropower remains one of the world’s most important sources of low-carbon electricity. A defining feature of hydropower generation is asset longevity: many plants started decades ago, and the core rotating equipment—turbines, generators, and bearings—are often maintained and upgraded rather than replaced.
That long service life is a strength, but it also creates a persistent challenge: mechanical and electrical aging mechanisms accumulate over time, and Excessive behaviour modes may develop slowly before becoming obvious. A hydro generator set is also not a single device; it is a coupled system with interacting subsystems and components. Figure 1 presents a schematic diagram of the main components of a hydropower plant.
Mechanical vibration behavior depends not only on component condition (bearings, shaft line, turbine hydraulic forces, alignment, rotor/stator interactions) but also on operating conditions. A machine may behave differently under varying power levels, reactive power conditions, hydraulic head, water flow, temperature, or transient events.


The issue
Conventional condition monitoring systems primarily focus on data collection and the provision of traditional analysis tools. Their role is primarily to obtain reliable data using various sensors, such as vibration, temperature, magnetic flux, partial discharge, and more.
Very often, operators use these systems for alarm and protection by setting (more or less) fixed thresholds.
In the end, experienced users need to interpret the data. The limitation of such an approach is that threshold alarming is typically designed for safety and protection, meaning the warning occurs when the signal represents a risk. This alarm is essential for preventing severe damage, but it also requires a constant user engagement for predictive purposes.
Most faults develop slowly, with subtle deviations that remain within alarm limits for weeks or even months before becoming evident. During that early stage, a threshold-based system may not detect the change while the machine is actually drifting away from its baseline behavior.
This situation is where the idea of behavioral monitoring becomes powerful: rather than asking, “Is vibration above a certain limit?”, the question becomes, “Is vibration consistent with what we expect from this unit operating at this exact combination of power, flow, temperatures, and speed?” If the expected behavior is known, then even small deviations are detectable very early.
The power plant personnel often lack time and resources to engage in machine monitoring, data analysis, and interpretation. They possess knowledge of their machines and subsystems, but they lack specific domain expertise in interpreting monitoring data. Due to the increasing number of digital subsystems in the power plant, excitation, data control and protection, turbine governor, SCADA, etc., the engineers do not have time to dedicate to learning the specific details in their day-to-day work.
Unless the machine experiences a specific problem, operators mainly use the monitoring systems intermittently rather than daily. They still collect the data continuously, but no one regularly looks at it. Alongside monitoring other systems, it can collect terabytes of data, posing a data crunching challenge. This volume underscores the growing importance of automated yet reliable data-tracking algorithms that leverage data collected by monitoring and control systems.
Solution: enhanced monitoring for early warning
A hydropower plant consists of many interacting (mentioned) subsystems, and this structural complexity makes real-time monitoring and interpretation of operational data a challenging task. To properly analyze and predict system behavior, an appropriate modeling framework is required.
At a high level, modeling approaches can be grouped into three main categories: physics-based models, hybrid models, and data-driven models. Physics-based models, often referred to as white-box models, are derived from explicit mathematical descriptions of system dynamics.
Their main advantage is that predictions are directly linked to physical mechanisms and can usually be interpreted in engineering terms. However, in practice, their application is often limited by uncertainty in model parameters, the effort required for system identification, and the computational burden of running such models online—especially under real-time constraints.
Hybrid, or gray-box, models attempt to combine physical insight with data-driven learning to overcome some of these limitations. This approach is particularly attractive in digital twin applications and can improve generalization across different operating conditions. Nevertheless, hybrid models typically require detailed physical representations and high-quality datasets, making adaptation to other hydropower plants time-consuming and, in many cases, impractical.
In this case, we adopt a data-driven approach. Data collected during verified periods of healthy and stable operation trained a baseline model that captures the normal behavior of the hydrogenerator unit. The data are first extracted from the monitoring system and then cleaned and normalized to ensure consistency and comparability across signals. Feature engineering techniques are applied to construct informative input variables.
We divided the dataset into training, validation, and test subsets. Then we selected, trained, and fine-tuned appropriate machine learning algorithms through hyperparameter optimization. We evaluated the model's performance on both the validation and test datasets.
After achieving satisfactory performance, we deployed the model within the monitoring pipeline and updated it as new operational data became available. Figure 2 illustrates an overview of this end-to-end workflow.


A key requirement of this methodology is the clear definition of normal operating conditions by experienced domain experts. Based on this reference, we train the model to quantify deviations of the current hydrogenerator state from normal behavior. This tuning enables the early detection of even small deviations and supports timely warnings through the monitoring system.
In parallel, we identify output signals that reliably reflect generator condition, and select the most relevant correlated signals as model inputs. After preparing the data, we evaluated and applied several candidate models, and finally used the Random Forest Regressor.
Random Forest Regressor is a supervised learning algorithm. This method uses an ensemble learning method for regression. Ensemble learning is a technique that combines predictions from multiple ML algorithms to produce more accurate predictions than a single model.
In this model, we tune key hyperparameters to improve its complexity and predictive performance. Also, to assess the learning level of the patterns in the data, the depth of the decision trees is examined.
By fine-tuning the criteria for node splitting and the thresholds for the minimum number of samples required for splits and leaf nodes, we could tune the model's complexity to prevent overfitting. This approach allows for adjusting different operating regimes, limitations, and thresholds.
In addition to tuning the model for achieving the best accuracy, the size, resources, and hardware requirements for operating the model in real-time with minimal delay are also important. We controlled the number of features considered at each split to reduce the overall model size, making both the training and prediction phases faster.
Since continuous manual inspection of residual signals is not feasible in practice, the residual—defined as the difference between measured and model-predicted values—is further processed. Figure 3 shows the five warning zones we defined for each residual signal. These zones are determined individually for each signal based on historical data from normal operation, signal resolution, applicable standards, and expert evaluation.


In addition, to simplify interpretation, the expected future behavior of the hydrogenerator under stable operating conditions is presented. We projected the evolution of both residual and measured signals by extrapolating current trends over multiple time horizons. Providing these projections helps operators assess whether an emerging deviation appears minor or is developing rapidly. This distinction supports faster and more consistent decision-making and contributes to improved operational reliability and safety.
In this case, we summarize residual and measured signals across four horizons—one hour, one day, seven weeks, and one month—allowing evaluation of both short-term deviations and slower drifts.
A case
We tested the method in real time as an add-on to a conventional monitoring system at two hydropower plant units in Croatia. Table 1 provides the technical specifications of both units.
| Machine | A | B |
| Hydroelectric Power Plant type | High-pressure diversion plant | |
| Machine type | Vertical suspended machine with three guide bearings | |
| Generator type | Three-phase synchronous generator: S 5877-20 | |
| Turbine type | Francis with a vertical shaft | |
| Nominal Power, MW | 113,166 | |
| Nominal discharge, m3/s | 45 | |
| Nominal Net Head, m | 269,652 | |
| Nominal generator rating | 140 MVA | |
| Nominal generator voltage | 14 400 V | |
| Nominal speed, RPM | 300 | |
| Nominal design air gap, mm | 32 | |
| Nominal transformer voltage | 14,4 kV/110 kV | 14,4 kV/ 220 kV |
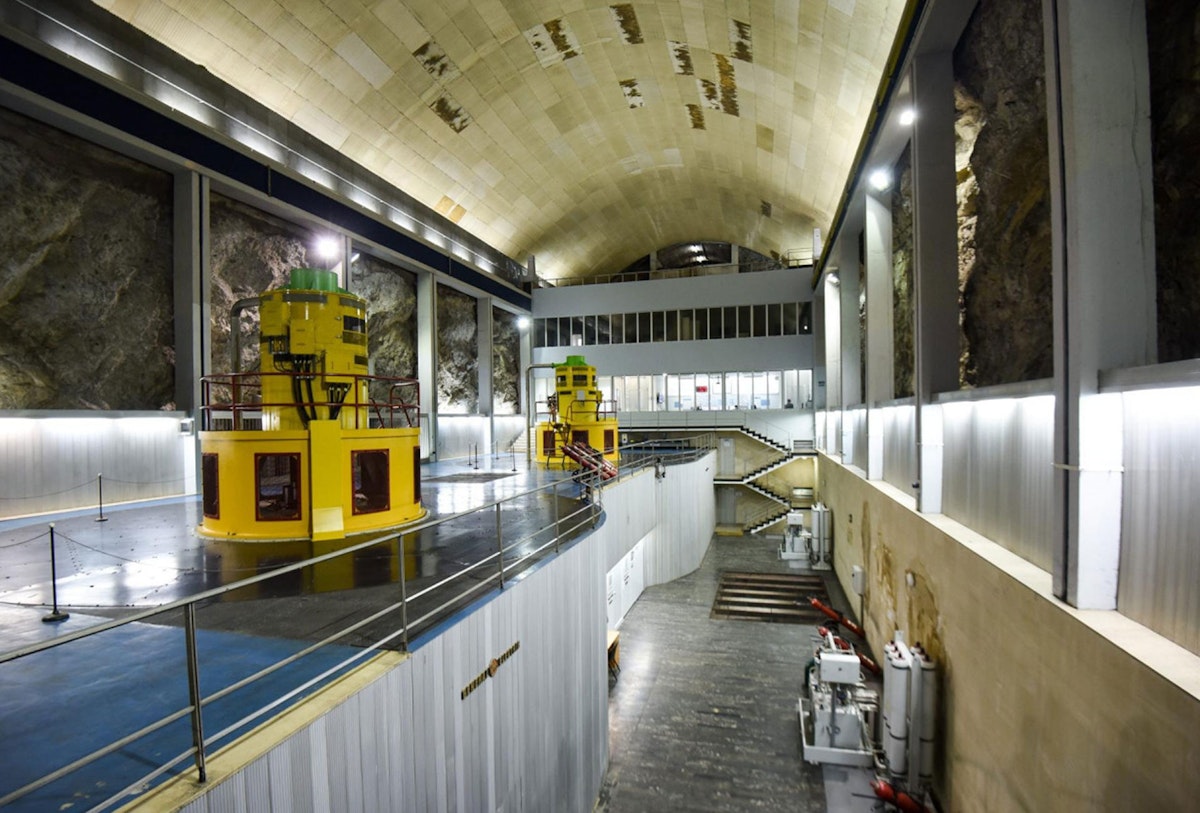
Figure 4 presents an overview of the hydrogenerator units in the powerhouse.


The monitoring system
In this case, we connected and integrated the monitoring system into the SCADA system from which we obtained process and operational parameters. These, among others, include active and reactive power, various temperature signals such as bearing segment, stator core, clamping finger, and winding temperatures, unit’s electrical and hydraulic parameters, flow, and pressure in the penstock and spiral casing. All of these are very important for diagnosing dynamic conditions, as vibrations can vary significantly with operating load and thermal conditions.
The system continuously writes all processing parameters into its diagnostic common database, alongside data points obtained from real-time signal processing of the aforementioned sensors. These typically include vibration amplitudes and phases at various order frequencies, RMS values, p2p values, etc. Figure 5 presents a schematic overview of the monitoring system. The monitoring database contains all the data since the commissioning in 2013.


We use the process quantities in the prediction model as valuable input parameters, correlating them in various combinations across historical records and comparing the results with the observed model-defined outputs. Before training and fine-tuning the model, we analyze the correlations between the selected output signals and all measured signals and select the best signals.
For this particular case, we selected the following inputs: Stator core temperature, Stator winding temperature, Flow, Pressure in penstock, RPM, Active Power (P), Reactive Power (Q), Maximum bearing segment temperatures on all three guide bearings, and also the thrust bearing. We set the deployed model to predict and follow the behavior of the extracted shaft displacement amplitude of the first harmonic (S1A). Table 2 lists the output signals considered in this case.
| Column A | Column B |
|---|---|
| RV-UGB-X-S1.A | Amplitude of the first harmonic of the relative vibration – Upper Guide Bearing, X direction (µm) |
| RV-UGB-Y-S1.A | Amplitude of the first harmonic of the relative vibration – Upper Guide Bearing, Y direction (µm) |
| RV-LGB-X-S1.A | Amplitude of the first harmonic of the relative vibration – Lower Guide Bearing, X direction (µm) |
| RV-LGB-Y-S1.A | Amplitude of the first harmonic of the relative vibration – Lower Guide Bearing, Y direction (µm) |
| RV-TGB-X-S1.A | Amplitude of the first harmonic of the relative vibration – Turbine Guide Bearing, X direction (µm) |
| RV-TGB-Y-S1.A | Amplitude of the first harmonic of the relative vibration – Turbine Guide Bearing, Y direction (µm) |
Then we trained the model using the most correlated signals and tuned the hyperparameters. We evaluated the model’s performance on the validation and test sets and analyzed the errors with domain experts to refine it further. Finally, we deployed the model and integrated it into the current monitoring system, enabling real-time monitoring.
For initial training data and evaluation, we used one year of normal data, from June 2022 to June 2023. We then tested the model with data from July 2023 to July 2024, and since July 2024, it has been running on the hydrogenator sets.
Test results
Owing to the proposed system's low latency and ability to generate outputs within a few milliseconds, it can be fully integrated into the existing monitoring system as an add-on module for early fault detection.
We have used the system to analyze several key plant outputs, including Smax (a maximum displacement from two perpendicular relative vibration probes), the partial discharge Qm+(PD) signal, total PD activity (NQN), and the first harmonic of relative vibration signals, and it has been operating in production at this power plant since July 2024.
To evaluate the platform prediction capabilities, we used historical data from 2020 and 2021 recorded during a period when a unit experienced an increase in turbine-bearing vibration. The ML algorithm was not available at the time, but we could evaluate the system's effectiveness using the recorded data.
Figure 6 provides an overview of the machine learning system dashboard, containing the most important “health indicators”. For each signal, a dedicated gauge shows the instantaneous residual, which represents the deviation from the expected normal behavior defined by the ML model. Clicking on any gauge displays the full time-series plot and detailed numerical values, enabling further inspection and diagnostic analysis.
On the left side (a), a time interval in which the hydro generator set still exhibits normal behavior is shown, while on the right side (b), an example of detected abnormal behavior is shown. To better convey the degree of deviation from the normal (expected) condition for human operators, five warning levels with different colors are defined, each based on the percentage of deviation from the normal (expected) values.
As the figure shows, initially, all signals were within the safe zone or normal state, so the residual values remain within the green zone. However, over time, as the monitored value gradually deviated from the expected normal behavior, it ultimately reached critically high amplitudes.
We equipped the monitoring system with conventional alarming thresholds that record the increase at a later stage. If this machine-learning model had been active at that time, the operator could have detected and mitigated the initial deviations from normal behavior more than a month before the values reached the conventional alarm values.


Data analysis
We have analyzed in detail each signal, the time of deviation detection, and the corresponding predicted values.
Relative vibration of upper guide bearing (RV-UGB)
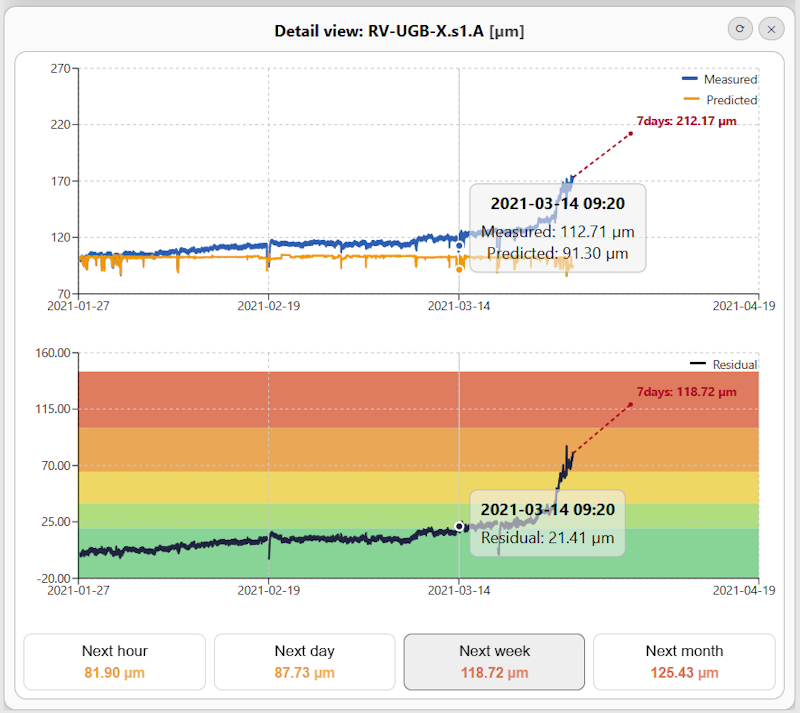
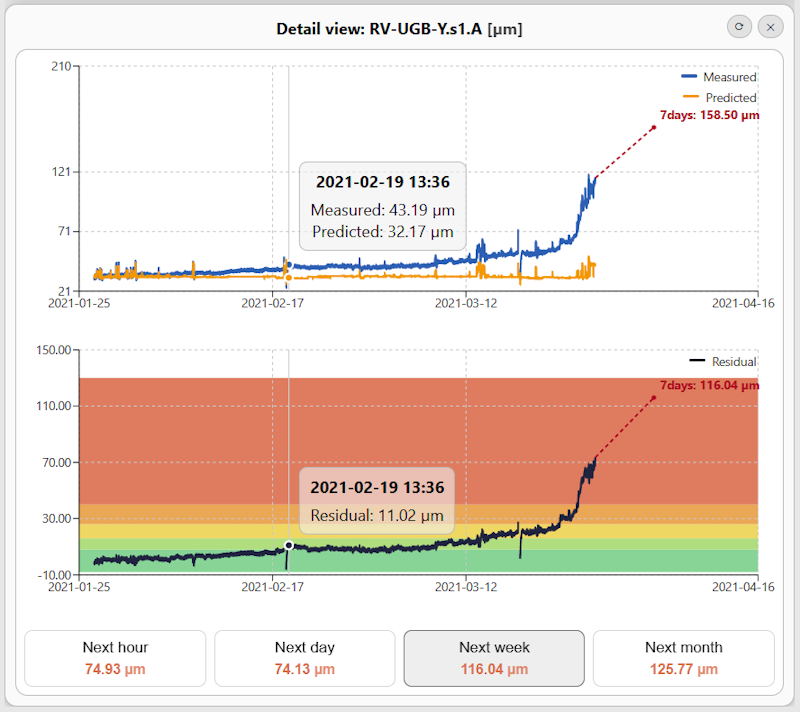
Figure 7 presents the measured and predicted values of the RV-UGB-S1. A signal for both the X and Y directions. For each signal, prediction panels corresponding to one hour, one day, one week, and one month beyond the most recent measurement are also displayed. As an illustrative example, the one-week prediction is activated in the figure and indicated by a dashed line in the diagrams. A comparison of the two directions shows that the deviation in the Y direction is significantly larger than that observed in the X direction.
Before the excessive behavior and the subsequent complete shutdown of the generator, the residual in the Y direction entered the red warning band, indicating a highly critical and potentially dangerous condition.
The earliest deviation in this hydro generator set—defined as the first exit from the normal band—was detected in the X direction approximately 37 days before the Excessive behaviour.
However, the signal later returned to the normal range. In contrast, deviations in the Y direction became visible about 14 days before the Excessive behaviour and increased rapidly as the event approached.
Relative vibration of lower guide bearing (RV-LGB)
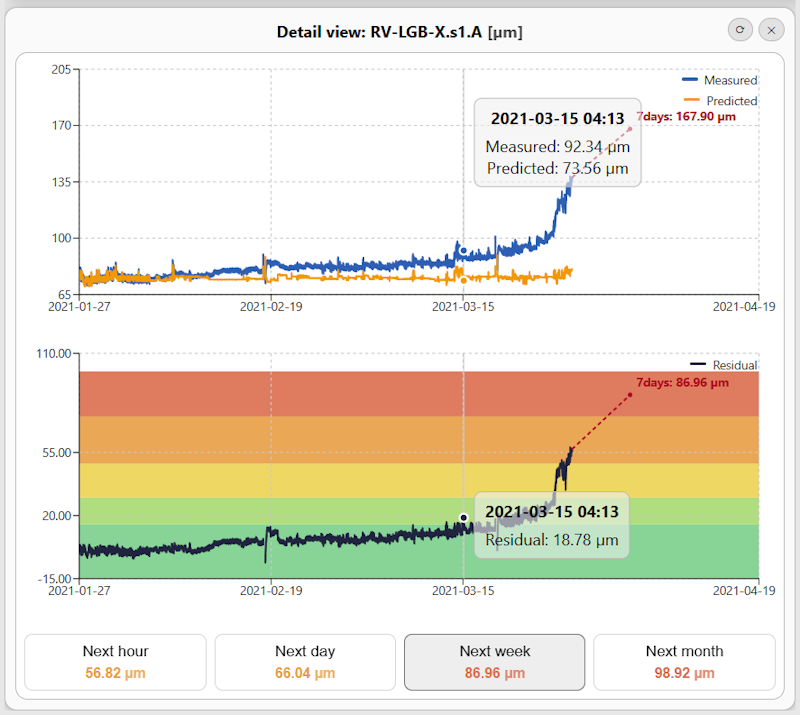
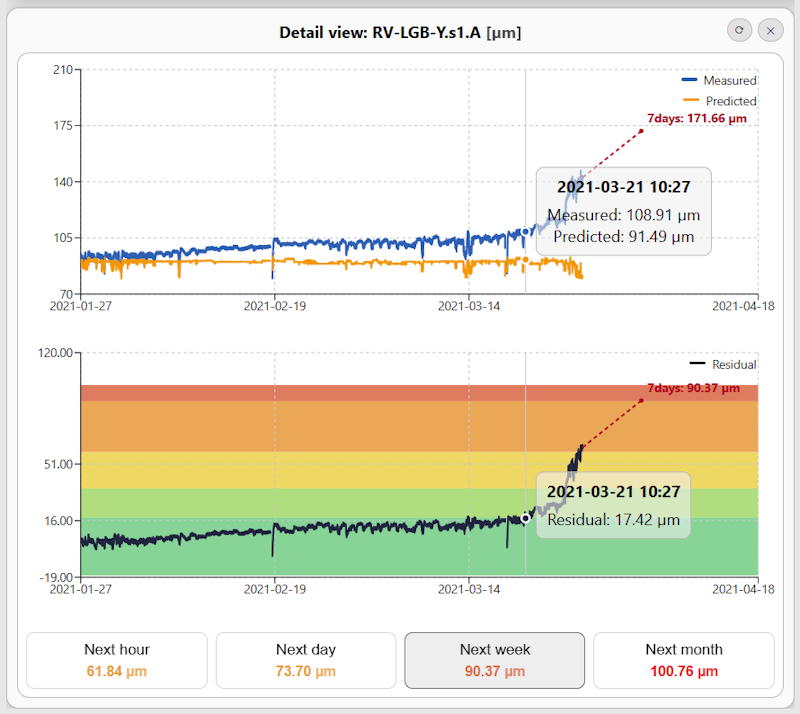
Figure 8 presents the measured and predicted values of the RV-LGB-S1.A signal for both the X and Y directions. The residual signal and deviation level in both directions are similar, and the maximum is within the orange band, indicating High Warning. The warning level in these signals is lower than that of the RV-LGB-1S signals. We detected the earliest deviation in the generator in the X direction approximately 13 days before the excessive behavior, and in the Y direction about 7 days before the excessive behavior.
Relative vibration of turbine guide bearing
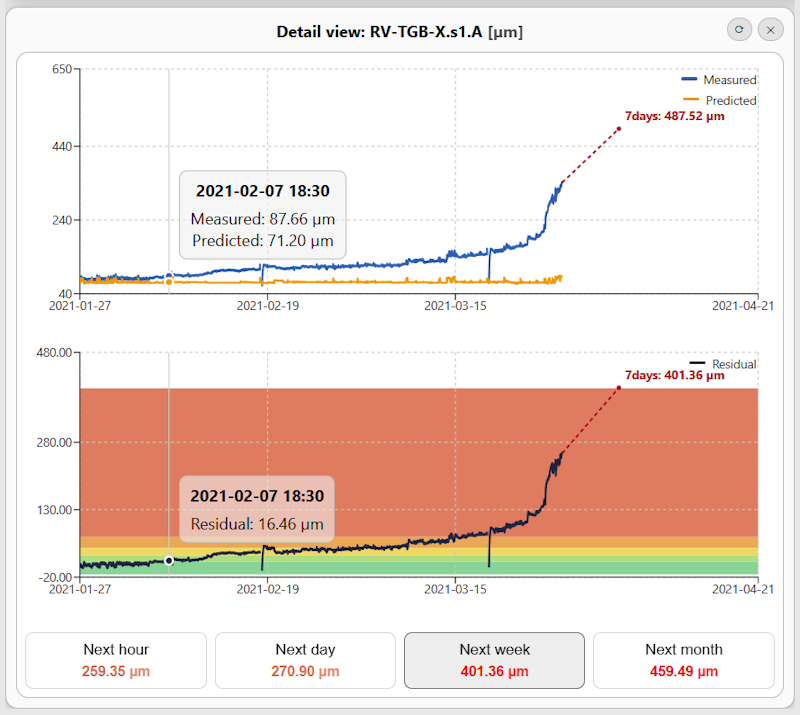
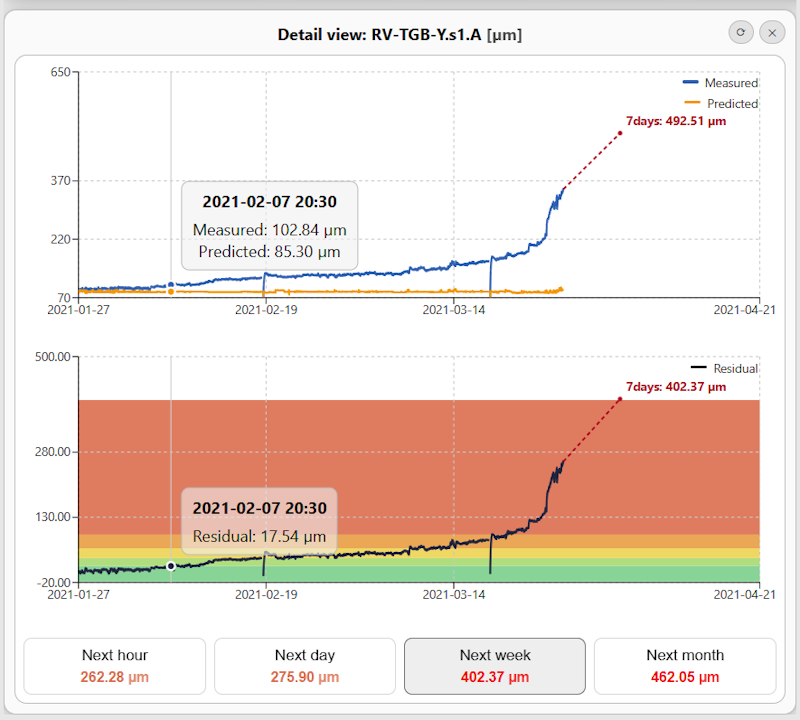
Figure 9 shows the measured and predicted values of the RV-TGB-S1.A signal for both the X and Y directions. Residual signals and deviation levels in both directions are similar, and the maximum occurs in the red band, indicating a highly critical and potentially dangerous condition. The warning levels in these signals are much higher and earlier than RV-HGB-S1 and RV-LGB-S1 signals.
The earliest deviations in these signals were detectable up to 47 days before the excessive behavior, representing a substantial time window for early warning and potential preventive action. Had the proposed system been operational and available at that time, the generated alerts could have enabled domain experts to intervene promptly and potentially prevent the resulting damage.
Conclusion
The implementation and analysis of the machine learning–based monitoring system in this case demonstrate the effectiveness of the proposed method. The results indicate that we can detect potential deviations in system behavior earlier than with conventional monitoring systems, and before reaching predefined limits and standard alarm thresholds. By learning the normal operating behavior of the hydrogenerator set and analyzing the residual signal, the method strengthens the conventional monitoring system and reduces the need for continuous manual analysis.
The residual-based approach provides earlier and clearer indications of emerging abnormalities. Table 3 shows that deviations from normal behavior in each monitored signal were observable several days in advance. It is particularly noteworthy that the first deviations in the signal RV-TGB-X-S1.A was detectable up to 47 days before the excessive behavior event and the complete shutdown.
| / | Low Warning | Warning | High Warning | Critical |
|---|---|---|---|---|
| RV-UGB-X-S1.A | 37 | 2 | 1 | - |
| RV-UGB-Y-S1.A | 14 | 14 | 5 | 2 |
| RV-LGB-X-S1.A | 13 | 2 | 1 | - |
| RV-LGB-Y-S1.A | 7 | 2 | 1 | - |
| RV-TGB-X-S1.A | 47 | 43 | 25 | 14 |
| RV-TGB-Y-S1.A | 47 | 37 | 19 | 7 |
This model is not limited to the signals presented in this case. It also applies to other outputs and condition indicators, such as partial-discharge measurements, air-gap signals, and other important machine-condition parameters. By extending the approach to multiple signal groups and integrating the resulting models, we can achieve a more comprehensive and reliable monitoring system.
This research represents an important step toward more effective data-driven analysis and moves the system closer to developing a digital twin of the generator. Such a digital twin would enable simultaneous simulation and real-time analysis, improve our understanding of the generator’s behavior, and support more informed operation and maintenance decisions.


