




Resonance and Vibration Analysis of High-Speed E-Motor Test Benches
Pascal Salzer
ERNST + Co Prüfmaschinen GmbH
October 2, 2026
High-speed e-motor test benches must combine high mechanical stiffness with precisely controlled vibration behavior to deliver reliable test results. At ERNST Prüfmaschinen, FEM simulations are combined with modal testing and vibration measurements to validate the dynamic behavior of complete test-bench systems. Using a Dewesoft SIRIUS X measurement system and DewesoftX analysis tools, the approach identifies critical resonances and brings simulation and real-world measurements into close agreement.
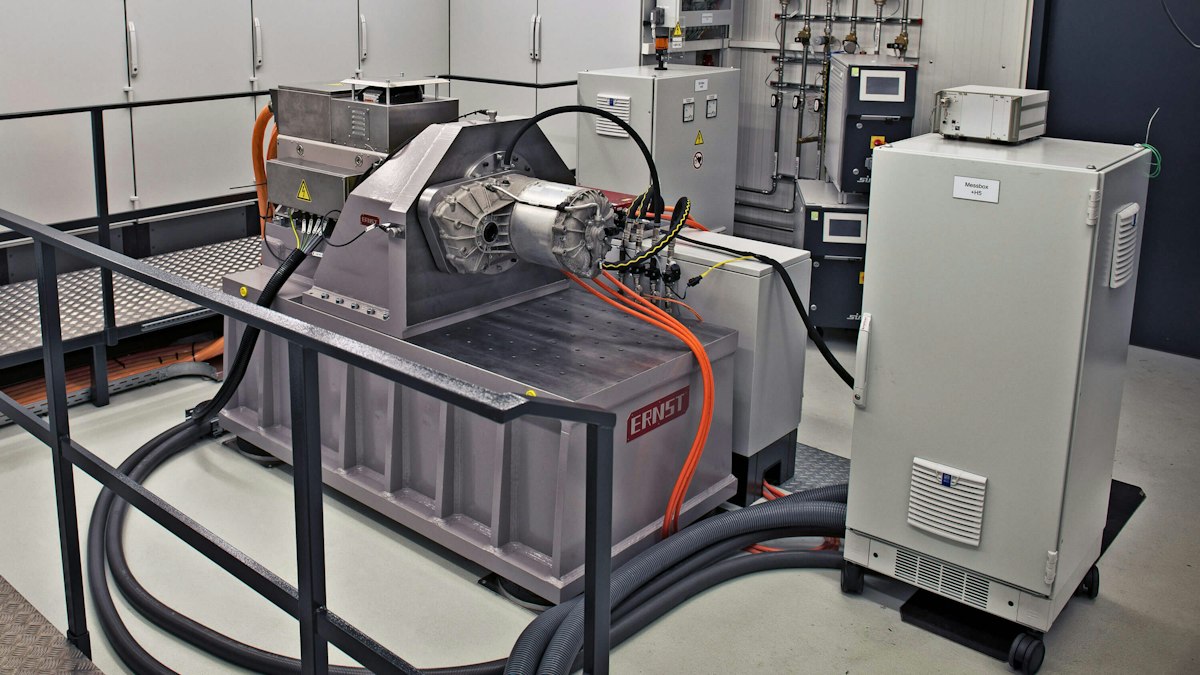
High-speed e-motor test bench resonance and vibration
Electric motor test benches are highly dynamic systems that must combine mechanical stiffness, repeatable measurement conditions, and application-specific adaptability. In high-speed applications, especially in electric drivetrain development, the test bench structure becomes a critical part of the measurement chain: its natural frequencies, damping behavior, and load paths directly influence the quality of the test results.
ERNST Prüfmaschinen develops and manufactures the complete mechanical set-ups for such test systems in-house. As a German system supplier, ERNST provides customized test bench mechanics, from the welded base frame and shaft connection to shaft guards and vibration isolation, all designed as an integrated solution for demanding engineering applications. This in-house approach lets ERNST align structure, function, and manufacturability from the start.
For electric motor test benches, this approach matters because the bench must safely handle high rotational speeds, substantial torque, and unbalanced excitation while maintaining controlled vibration behavior. ERNST addresses these requirements with high-stiffness base frames, tuned structural concepts, and proven mechanical interfaces that can be adapted to the specific test setup, including high-speed configurations and powertrain-related adaptations.
Why resonance matters in high-speed e-motor testing
High-speed applications will continue to gain importance in the coming years. This makes in-depth expertise in natural-frequency analysis, modal testing, and harmonic response simulation increasingly relevant to developing electric-motor test systems.
Several factors drive the trend toward higher motor speeds. Higher rotational speeds can increase power density and support more compact drivetrain concepts. In some applications, they may also reduce the amount of rare-earth material required per unit of power—particularly relevant for electric mobility —while aerospace applications place additional emphasis on low mass, compact design, and high power density. High-speed electric motors can also enable drive units with a single reduction stage, avoiding additional intermediate stages and the associated components, wear parts, losses, and installation space.
At the same time, higher speeds place greater demands on test-bench mechanics. The base frame must remain sufficiently stiff while the overall test setup becomes more compact. When geometric or installation-space constraints make it impossible to design a fully resonance-free system across the entire required operating range, resonance assessment and harmonic response analysis become essential. This is particularly relevant for retrofits, conversions of existing test benches, and test setups for gearboxes or other drivetrain components — evaluating individual components alone is not sufficient; the dynamic interaction of the complete mechanical system must always be considered.
A preliminary FEM simulation provides a valuable first estimate at the beginning of a project, when design changes can still be implemented efficiently. However, it inevitably relies on assumptions and unknown boundary conditions and therefore cannot fully predict the exact vibration response of the real system. As a project progresses, modifications become increasingly time-consuming and costly — identifying potential resonance issues as early as possible is therefore a major advantage of simulation-supported development.
For a reliable final assessment, simulation must be accompanied by real measurements. The quality and interpretation of the measurement data are decisive, even though comprehensive measurements under real operating conditions are not always possible to the same extent as in a simulation environment. Here, the preliminary simulation offers an important benefit: it helps identify critical locations, relevant operating speeds, and the vibration directions to measure in detail. The resulting measurement data can then validate and refine the model, leading to a final simulation that more accurately represents actual system behavior.
This case study therefore looks not only at the measurement task itself, but also at ERNST’s engineering contribution as the supplier of the test rig mechanics: a mechanically stable, application-oriented platform that enables reliable vibration measurements and simulation-based validation under real operating conditions.
Avoiding resonance in high-speed e-motor test benches
In existing test bench systems, the target is clear: the mechanical structure should remain free of natural frequencies across the full operating speed range, from standstill to maximum speed. This ensures the test bench does not influence the measurement and that the recorded vibration behavior reflects the device under test rather than the setup mechanics.


At ERNST Prüfmaschinen, test benches are engineered as customer-specific systems, and each installation is therefore designed individually. In this context, finite element analysis of the base frame is central to the design and validation process.
After welding, every in-house manufactured base frame undergoes an internal verification step in which the first natural frequency is assessed to confirm that the mechanical configuration remains free of resonance. Applying the Dewesoft Modal Testing, the maximum rotational speed for this project is 20,000 rpm, corresponding to 334 Hz.


With a second iteration loop of the FEM analysis and the associated modal-test validation, the model can be calibrated to within just a few Hertz, as the comparison between measured and simulated results below shows.
|
FEM screenshot |
FEM analysis (Hz) |
Dewesoft modal test (Hz) |
Deviation FEM–Modal (%) |
|
|
568 |
570.5 |
-0.44 |
|
|
698.5 |
700.5 |
-0.29 |
|
|
728 |
723 |
0.69 |
|
|
749.5 |
747.5 |
0.27 |


This overview shows that the second validation loop yields highly accurate results, with deviations under 1%. The higher-order modes also help validate the FEM model, ruling out coincidental agreement or overlapping modal contributions.
The first resonance lies above 500 Hz, providing sufficient margin above the maximum rotational speed of 20,000 rpm (334 Hz). This means any resonance potentially introduced by the base frame can be excluded—a finding that is also essential later, when drawing conclusions about which components may be responsible for resonances in the overall setup, especially when the dynamics of the dyno and the device under test are not yet fully known.
Resonance challenges in modified e-motor test benches
In practice, many parameters remain unknown, especially when an existing system is modified—for example, by reusing a base plate as the foundation for a new setup or by adding an intermediate gearbox to reach higher rotational speeds. In such cases, the mechanical system is not fully characterized, so resonances may be unpredictable at the design stage and cannot be completely avoided.
A typical example is a combustion-engine test cell originally designed for speeds up to 10,000 rpm that is later upgraded with a high-speed gearbox to reach 25,000 rpm. This extends the speed range into a region where the structure's dynamic behavior can change significantly, and previously irrelevant resonances can become critical. The same applies to modified base frames, where material, geometry, and boundary conditions strongly influence actual stiffness and damping.
The main limitation is often the structure's material thickness and geometry. A base plate, for example, has a low thickness-to-length/width ratio, which can introduce bending and torsional resonances. As a result, the first resonance or higher-order modes may appear in unexpected frequency ranges—which is why experimental modal analysis, followed by FEM validation, is essential to identify and refine the real dynamic behavior.


The system shown above—base plate, headstock, and a high-speed synchronous dyno—is mostly stiffness-determined by the base plate itself. The base plate's resonances closely match the complete system's behavior.


The same is true when designing individual components as part of a modification: expect significant deviations. In most cases, designing components individually is not enough— the entire mechanical system must be considered and analyzed together.


|
FEM screenshot |
Complete system (Hz) |
Base plate/headstock solo (Hz) |
|
|
145 |
150 |
|
|
195 |
187 |
|
|
315 |
327 |
|
|
351 |
371 |
|
|
380 |
382 |
|
|
449 (headstock) |
557 (headstock solo) |


The first five natural frequencies can be assigned directly to the base plate, both in resonance frequency and mode shape. Three of these modes lie within the operating speed range, while the fourth, at 351 Hz, is only 5% above maximum speed and could therefore still become noticeable at 20,000 rpm.
The sixth natural frequency originates from the headstock. Here, however, it becomes clear why the entire system must be considered: on its own, with a fixed bottom surface, the headstock resonates at 557 Hz — but in the complete system, the stiffness of the base plate also plays a decisive role, and the resonance drops to 449 Hz, a reduction of -19.4%.
Conclusion: Analyzing the overall system is essential, but risk remains whenever unknown components are modified. Simulating natural frequencies alone is no longer sufficient to guarantee functionality — it must also be determined whether the resonances that occur are critical or uncritical within the operating speed range.
For this purpose, an extended harmonic response analysis is carried out on top of the existing natural-frequency simulation. Here, the mass and damping of the entire system — including the loss factor — as well as the prescribed excitation in the form of unbalance, play a key role.
As the acceptance criterion for the setup, the machinery directive DIN ISO 20816-3 is applied, referencing the actual vibration velocity in mm/s. The target is to keep vibrations below the A/B zone boundary of 2.3 mm/s.
High-speed e-motor test bench for resonance validation
In this internal project, we modified an existing ERNST Prüfmaschinen system to model and simulate the entire system. The engine support is fixed to the base frame on the A-side via a flange connection.
This is compared with a design using a relatively long device under test, which is likewise flanged to the A-side but has no additional support on the B-side. In certain configurations, this can cause a high vibration level on the B-side, since the connection to the test bench often differs from the original configuration.
|
Power |
400 kW (overload) |
|
Speed range |
Up to 20,000 rpm |
|
Torque |
Up to 280 Nm (overload) |


How mechanical modifications affect resonance behavior
ERNST uses its standard engine support, MS104-540, typically used for combustion-engine testing. Its advantage is that it is available in stock and easy to adjust, with a flexible spindle length.


The next step is to add the engine support to the existing CAD model and simulate the overall system, focusing on the behavior at the B-side of the MS104-540. Here, the engineering team is looking for resonances within the speed range—preferably at a moderate operating speed of around 100 Hz (6,000 rpm), where all components on the test-bed side run smoothly.
|
FEM screenshot |
Natural frequency of the complete system |
|
103.5 Hz (horizontal direction) |
|
105 Hz (vertical direction) |


The two natural frequencies shown above lie very close together:
Resonance at 103.5 Hz (horizontal direction)
Resonance at 105 Hz (vertical direction)
This effect results from the engine support spindle's rotationally symmetric design.
Unfortunately, this makes precise analysis of the individual resonances more difficult, since the respective system behavior cannot simply be assumed to be identical in both directions. The modal test and vibration measurements therefore need to be evaluated explicitly for each upcoming resonance.
Measurement equipment for modal and vibration testing
The vibration validation used a Dewesoft SIRIUS® X measurement system - a flexible measurement platform for both modal testing, operational vibration, power, and general multi-physics analysis.
For the high-frequency impact measurements required during modal testing, we used a SIRIUS-HS module, which supports sampling rates up to 1 MS/s. An AE100.303 accelerometer captured the structural response, while an IH20 impact hammer provided the controlled excitation needed to identify the test bench's natural frequencies and mode shapes.
The measurements were acquired and analyzed in DewesoftX, the software environment for the complete measurement workflow. The Modal Testing module was used to perform experimental modal analysis and determine resonance frequencies. This allows direct comparison of the measured structural behavior with the natural frequencies predicted by FEM simulations.


For operational testing, the FFT Analyzer examined the frequency content of the measured vibration signals and identified resonances during speed sweeps. The Rotor Balancing module determined the rotating system's unbalanced excitation. Together, these tools enabled correlation between the measured unbalance and the resulting structural vibration, and comparison of the measured response with the harmonic-response simulations.
Baseline modal and vibration measurements
The first step is to measure the system behavior before the modification. This includes modal tests and vibration measurements of the test bed alone.
Baseline modal test of the test bench


|
Modal test axial |
523.5 |
Hz |
The modal test of the base frame alone was carried out up to 1,000 Hz, with the first resonance at 523.5 Hz — well above the 20,000 rpm operating speed (334 Hz). This confirms that no natural frequencies fall inside the speed range.
Baseline vibration measurement up to 20,000 RPM
|
Measurement: speed 0 – 20.000 rpm, without torque |
Drive direction + |
|
Measuring point: Intermediate bearing |
vertical/horizontal/axial |
|
Test bed config: test bed solo |
|


|
Vibration velocity axial |
0.3 |
mm/s |
|
Vibration velocity horizontal |
0.5 |
mm/s |
|
Vibration velocity vertical |
0.3 |
mm/s |
Conclusion, reference measurements: Both the modal test and the vibration measurement confirm a healthy system—no natural frequencies within the speed range up to 20,000 rpm, and the first resonance from the base frame lies above 500 Hz (30,000 rpm). Acceptance is successful.
E-motor test bench modification with engine support
The vibration sensor is placed at the spindle end, where the highest vibration level is expected, as also shown in the FEM analysis in the area marked in red.

Modal testing of the modified e-motor test bench
The modal test was carried out in two directions, horizontal and vertical, to cover both resonances around 100 Hz. The resulting loss factor is also used in the subsequent harmonic simulation.

|
Modal test horizontal |
103.6 |
Hz |
Loss factor η |
0.0043 |
|
Modal test vertical |
105.8 |
Hz |
Loss factor η |
0.0031 |
The necessary frequency range extends up to 150 Hz (9,000 rpm), so the subsequent vibration measurement covers at least 7,000 rpm (117 Hz). This provides some overspeed margin to confirm that the vibration level drops again once the resonances have been passed.
Resonance excitation using controlled unbalance
DewesoftX also includes the Rotor Balancing application, normally used for dynamic balancing during acceptance tests. In this case, we specifically needed a defined unbalance to excite the test system at the critical speed of around 100 Hz (6,000 rpm).
The unbalance was therefore determined at a low vibration level, outside the resonance speed, to avoid measuring the resonance effect instead of the unbalance effect on the system — at 10,000 rpm (167 Hz).

|
Unbalance, horizontal direction |
137 g·mm |
All individual parts of the high-speed shaft connection were balanced during manufacturing, each with its own balance report. However, the assembly process always introduces some additional unbalance to the overall shaft, for example through minor misalignment or the addition of fixation screws. The resulting unbalance of 137 g·mm is at a suitable level, as confirmed by the earlier vibration measurement up to 20,000 rpm, which showed no vibration issues.
The Rotor Balancing module focuses on the vibration level at the 1st order (equal to operating speed). Mechanical resonances at the base frame are likewise visible at the 1st order in the Dewesoft FFT analysis. Therefore, it is important to measure the unbalance at an uncritical speed.
The measurement was carried out in one direction (horizontal), directly at the coupling between the torque transducer and the intermediate bearing.
Vibration analysis during a speed sweep up to 7,000 RPM
|
Measurement: speed 0 – 7.000 rpm, without torque |
Drive direction + |
|
Measuring point: engine support B-side |
vertical/horizontal/axial |
|
Test bed config: test bed + engine support |
|


This vibration measurement covers speeds up to 7,000 rpm, so it captures both resonances of interest. At maximum speed, the vibration level drops below 0.5 mm/s in all directions — the critical speed range is therefore between roughly 5,400 and 6,800 rpm.
All four vibration peaks are visible in the measurements above. To interpret them, three criteria were defined to identify which peaks are actually the resonances originating from the engine support:
|
Criterion 1 |
Modal test and vibration peak occur at a similar frequency. |
|
Criterion 2 |
Vibration peak occurs in a plausible direction (horizontal/vertical) |
|
Criterion 3 |
Dominant vibration velocity occurs at the 1st order (equal to operating speed) |
|
Operation point (rpm /Hz) |
Criterion 1: modal test (Hz) |
Criterion 1: dominant direction |
Criterion 2: vibration (mm/s) |
Criterion 2: dominant order |
Criterion 3: 1st order (mm/s) |
Result |
|
5,432 / 90.5 |
– |
vertical |
1.1 |
5th (449.2 Hz) |
– |
❌ |
|
5,776 / 96.3 |
103.6 |
horizontal |
2.6 |
1st |
2.7 |
✔ |
|
6,262 / 104.4 |
105.8 |
vertical |
3.6 |
1st |
3.7 |
✔ |
|
6,778 / 113.0 |
– |
vertical |
1.6 |
4th (449.2 Hz) |
0.3 |
❌ |
|
7,000 / 116.7 |
– |
– |
– |
– |
– |
❌ |
The operating point at 5,776 rpm corresponds to the resonance in the horizontal direction, and the operating point at 6,262 rpm corresponds to the resonance in the vertical direction.
Modal and vibration measurement results
All necessary measurements were completed, and the FEM analysis matches the measurements taken at the real test bed. The resonance frequencies from the modal test and the vibration measurements are close. The small discrepancies between the FFT analysis and the rotational speed measurement result from the laser sensor's limited sampling rate (one impulse per 360°) during the dynamic speed ramp.
In addition, the maximum vibration peak depends on the dynamic speed gradient — under steady-state operation at a constant speed within the natural frequency, the system would not reach the same maximum vibration level. Finally, we measured unbalance at only one plane (horizontal), at the coupling between the intermediate bearing and the dyno, so we use the effective unbalance at the engine support B-side only as an indicator for the simulation.
|
Resonance No. |
Frequency |
Unbalance |
Loss factor η |
Dominant direction |
Vibration speed |
|---|---|---|---|---|---|
|
1st resonance |
103.6 Hz (96.3 Hz) |
137 g·mm |
0.0043 |
horizontal |
2.6 mm/s |
|
2nd resonance |
105.8 Hz (104.4 Hz) |
— |
0.0031 |
vertical |
3.6 mm/s |
Harmonic response analysis: first simulation loop
The harmonic response analysis is based on the measurement data summarized above. Each natural frequency is simulated separately to account for the different damping behavior (loss factor η) at each resonance.
|
Resonance No. |
Frequency |
Unbalance |
Loss factor η |
|---|---|---|---|
|
1st resonance |
103.3 Hz (horizontal) |
137 g·mm |
0.0043 |
|
2nd resonance |
104.6 Hz (vertical) |
(137 g·mm) |
0.0031 |
The relevant simulation results are split by direction: 103.3 Hz in the horizontal direction and 104.6 Hz in the vertical direction b.


|
Resonance No. |
Frequency |
Unbalance |
Loss factor η |
Dominant direction |
Vibration speed |
|
1st resonance |
103.3 Hz |
137 g·mm |
0.0043 |
horizontal |
3.3 mm/s |
|
2nd resonance |
104.6 Hz |
— |
0.0031 |
vertical |
4.3 mm/s |
The deviations from the measured values result from measuring unbalance only in the horizontal direction, as well as from contact conditions and mechanical clamping of the engine support. To bring the simulation closer to the measured data, we subsequently adjusted the excitation and loss factor.
Harmonic response analysis: FEM model optimization
Changing the boundary conditions in the simulation requires little effort, allowing an even better match between the simulation and the real measurement.
|
Resonance No. |
Frequency |
Unbalance |
Loss factor η |
Dominant direction |
Vibration speed |
|
1st simulation loop |
|||||
|
1st resonance |
103.3 Hz |
137 g·mm |
0.0043 |
horizontal |
3.3 mm/s |
|
2nd resonance |
104.6 Hz |
— |
0.0031 |
vertical |
4.3 mm/s |
|
2nd simulation loop |
|||||
|
1st resonance |
103.0 Hz |
130 g·mm |
0.0051 |
horizontal |
2.6 mm/s |
|
2nd resonance |
104.6 Hz |
100 g·mm |
0.0042 |
vertical |
3.5 mm/s |


Comparing the measurement data and the modified simulation (2nd loop), the measured values and the simulation results show good agreement, as summarized in the table below. The figures above also compare the preliminary and optimized simulation loops.
|
Vibration Measurement Data |
|||||
|
Frequency |
Unbalance |
Loss factor η |
Dominant direction |
Vibration speed |
|
|
1st resonance |
103.6 Hz (96.3 Hz) |
137 g·mm |
0.0043 |
horizontal |
2.6 mm/s |
|
2nd resonance |
105.8 Hz (104.4 Hz) |
— |
0.0031 |
vertical |
3.6 mm/s |
|
Second simulation loop |
|||||
|
1st resonance |
103.0 Hz |
130 g·mm |
0.005 |
horizontal |
2.6 mm/s |
|
2nd resonance |
104.6 Hz |
100 g·mm |
0.004 |
vertical |
3.5 mm/s |
These results once again demonstrate that a preliminary simulation can provide a reliable initial estimate of the actual system behavior. However, a detailed and meaningful assessment requires integrating simulation and experimental measurement. Only by combining both approaches can the system behavior be analyzed with sufficient accuracy and confidence.
The final simulation is considered equivalent in its ability to describe the system behavior; further refinement would not add significant additional benefit and is therefore not considered necessary. ERNST is highly satisfied with the results achieved.
A particular challenge arises from the component's near-symmetrical geometry, which causes two resonances to occur in proximity. In practical applications, mechanical assemblies are generally not perfectly symmetrical — nevertheless, the superposition of several dynamic effects can also occur in real systems and must be considered during evaluation.
For this reason, interpreting the measurements and the conclusions drawn from them is central: without this interpretation, the subsequent simulation cannot be supplied with the correct input data.
E-Motor test bench resonance validation results
Across all validation stages, the technical results confirm that ERNST’s test-bench mechanics and the combined FEM/measurement approach deliver an accurate and reliable basis for E-motor testing at high speed:
FEM and modal-test results for the base frame agree to within less than 1% deviation after the second simulation loop, confirming that the model can be calibrated to a level of accuracy suitable for design decisions.
Reference measurements on the unmodified test bed confirm a resonance-free operating range up to 20,000 rpm, with the first natural frequency more than 500 Hz above the maximum operating speed; acceptance was successful.
For the modified set-up with engine support, the measured and simulated resonance frequencies, unbalance levels, and vibration directions show good agreement, giving ERNST a validated method for assessing retrofits and other modified configurations where the dynamic behavior is not fully known upfront.
The approach directly supports compliance with the DIN ISO 20816-3 acceptance criterion used for the test bench.
For the customer, the main benefit is confidence that the system's function is guaranteed: components at these speeds are sensitive to resonance and can fail. Because many test bench parts—such as PST gearboxes or dynos—are often customized, a failure typically means long downtime, and repair, lost test time, and misanalysis can quickly add up to a five-figure cost.
Key factors for accurate resonance validation
Several factors were decisive for the successful validation of the high-speed E-motor test bench:
Single-source mechanical engineering: because ERNST designs and manufactures the base frame, shaft connection, shaft guards, and vibration isolation in-house, structure, function, and manufacturability could be aligned from the start — rather than integrating components from multiple suppliers.
A precise, matched measurement chain: the Dewesoft SIRIUS X data acquisition system, together with the modal-test, Rotor Balancing, and FFT Analyzer applications in DewesoftX, allowed the FEM model to be calibrated against real measurements to within a few Hertz.
A combined simulation-and-measurement methodology: relying on FEM simulation alone was not sufficient, particularly for modified or retrofitted systems with unknown dynamic behavior. Only the interaction of preliminary simulation, modal testing, and harmonic response analysis provided results accurate and trustworthy enough to base acceptance decisions on.
Customer satisfaction: ERNST rated the final simulation as equivalent in its ability to describe the real system behavior, with no further refinement considered necessary.
The Workshop Manager at KIT Karlsruhe said: "What convinced me most is how simple the handling has become and knowing that the resonance behavior of the complete setup is under control. On our initial set-up with base plate and headstock, aligning the coupling between DUT and dyno alone took several days. With the new base frame design, that same alignment is now a plug-and-play job taking just minutes — and we no longer have to guess how the whole system will behave.".
High-speed e-motor testing beyond 30,000 RPM
At ERNST, base frames are generally designed so that their relevant operating range is free of resonance. ERNST typically offers a detailed, coupled analysis of natural frequencies, damping, unbalance excitation, and harmonic vibration response on a project-specific basis—for example, for especially demanding high-speed applications, customer-specific modifications, or complex test-bench configurations.
ERNST is already developing new concepts for increasingly high rotational speeds, including intermediate-bearing solutions with oil-air lubrication and high-speed test-bench configurations for applications at and beyond 30,000 rpm. ERNST’s test-system components already include shaft connections and high-speed gearboxes rated up to 30,000 rpm, as well as machine base frames designed for resonance-free operating ranges up to this speed.
The base frame is now designed for operating speeds up to 30,000 rpm and illustrates continued development toward compact, robust, and dynamically reliable high-speed test systems.
