




Real-Time WAAM Process Monitoring and Defect Detection

Marco Ribichini & Giorgio de Alteriis, Alessia Teresa Silvestri, Eleonora Viola, Antonino Squillace, and, Annalisa Liccardo
University of Naples Federico II
October 23, 2026
Wire Arc Additive Manufacturing (WAAM) promises fast, large-scale metal 3D printing, but ensuring consistent quality remains a major challenge. By combining Dewesoft's synchronized data acquisition with advanced wavelet coherence analysis, researchers at the University of Naples Federico II and Universitas Mercatorum developed a real-time monitoring method that detects process instability before defects form. The result is a smarter, more reliable, and more cost-effective approach to industrial metal additive manufacturing.
What is wire arc additive manufacturing (WAAM)?
Imagine having to 3D-print a multi-meter-long metal component destined for a commercial airliner or a power-generation turbine. Standard metal powder printers won't work: they are too small, slow, and expensive. This is where Wire Arc Additive Manufacturing (WAAM) comes into play.
In practice, WAAM technology is a perfect marriage between industrial robotics and electric arc welding. Using a metal wire as the feedstock and a welding torch as the heat source, the system deposits overlapping weld beads layer by layer to shape large-scale components in record time and with minimal material waste.


Challenges in WAAM process monitoring and quality control
Maintaining process stability in large-scale metal 3D printing
However, there is a big “but.” WAAM is a young and complex technology, and the quality of the final component relies heavily on process stability. Small variations in operating parameters can alter the behavior of the electric arc and generate defects.
Until now, quality was verified after the fact using expensive destructive testing or 3D scans. But how can you tell, while the machine is printing, whether the process is stable or you are wasting hours of work and kilograms of precious metal?
To answer this question, a research team from the University of Naples Federico II and Universitas Mercatorum, led by Prof. Giorgio de Alteriis and Prof. Alessia Teresa Silvestri, has developed an innovative, non-invasive real-time monitoring framework based on electrical current acquisition. Dewesoft Italy actively collaborated on this initiative, combining academic expertise with the precision of our DAQ solutions.
Understanding arc current signals in cold metal transfer (CMT)
To make the WAAM process extremely clean, spatter-free, and low in heat input, an advanced variant of arc 3D printing called Cold Metal Transfer (CMT) is used.
In CMT, metal transfer occurs in a cyclic and controlled manner: the wire advances until it touches the molten pool (creating a short circuit), the current is instantly reduced, and the wire is mechanically retracted to promote the perfect detachment of the metal droplet without spatter.
This cycle repeats hundreds of times per second, generating a highly non-stationary and dynamic current signal. The arc current fluctuates abruptly between high-energy "pulse" phases and low-energy "short-circuit" phases.
Analyzing this signal with traditional metrics (such as global RMS values or the classic Fast Fourier Transform, FFT) is ineffective:
RMS values average out the signal, losing the extremely rapid transients during which defects originate.
The FFT assumes that the signal is stationary, whereas the CMT electric arc continuously adapts its frequency and cycle duration in real time via a closed-loop control system.


Using wavelet coherence for real-time WAAM monitoring
Instead of analyzing the signal in the time or frequency domain, the Naples team proposed mapping it onto the time-frequency plane using Wavelet Coherence (WC).
The approach involves real-time comparison between the current signal acquired from the arc and an ideal mathematical model (a reference process signature obtained from the sequence imposed by the welding power source).
Wavelet coherence, between the actual signal and the reference model at scale and time position is defined as:
Where and are the continuous wavelet transforms (CWT) of the two signals, the asterisk represents the complex conjugate, and is a two-dimensional smoothing operator.
To convert this complex 2D map into a simple numerical indicator suitable for industrial control software, the researchers defined the Mean Global Wavelet Coherence (MGWC).
First, the Global Wavelet Coherence (GWC) is calculated by integrating over time:
Finally, the MGWC indicator is obtained by integrating the GWC over the frequency range of interest. (between and ):
An MGWC value close to 1 indicates perfect overlap with the ideal process (absolute stability), while a sharp drop in the value highlights printing instability or the formation of a defect.
WAAM process monitoring with Dewesoft data acquisition


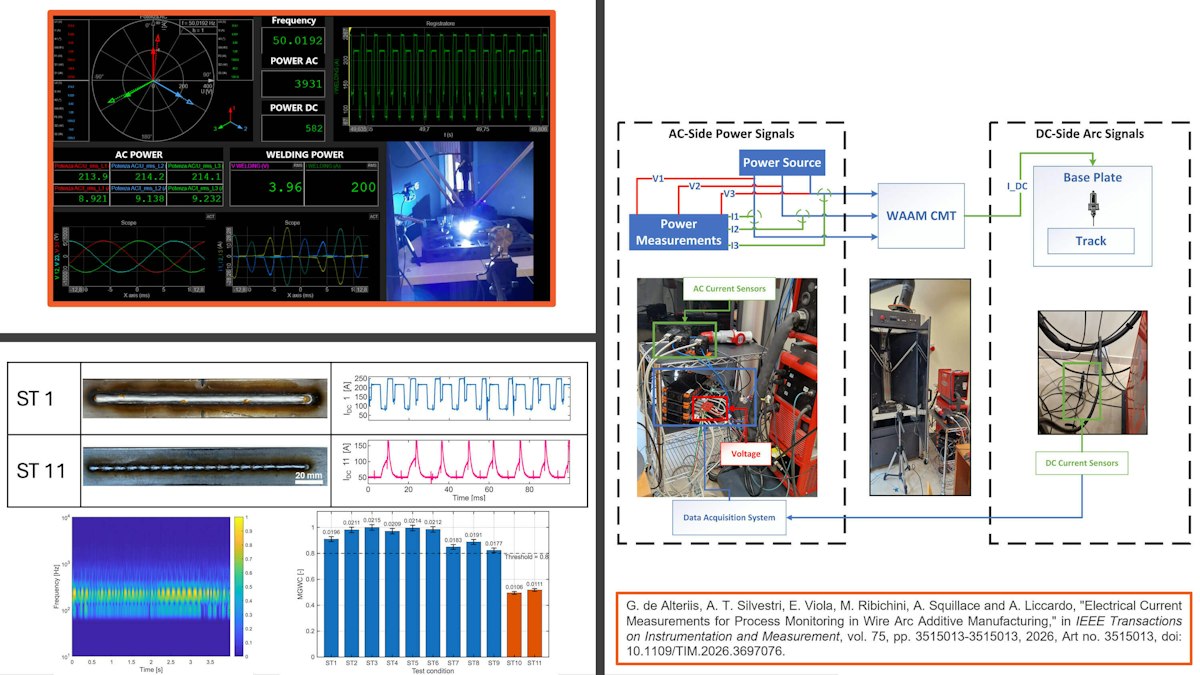
To validate this metrological methodology, Dewesoft Italy and researchers from the University of Naples Federico II and Universitas Mercatorum designed a synchronous acquisition system capable of measuring both the upstream energy absorbed (three-phase AC side) and downstream arc dynamics (DC side), extending the analysis to other essential physical parameters. [1]
The choice of instrumentation was guided by the need to operate in an industrial environment with severe electromagnetic interference from the arc generator. The system uses Dewesoft DC-CT-1000I-S22DA current transducers to monitor the three power supply phases and the DS-CLAMP-300DC current clamp to measure the arc current, with acquisition with the Dewesoft SIRIUSi-HS HV/LV DAQ module (see Figure 1).


Measuring three-phase power consumption on the AC side
To calculate the total energy consumed by the machine, the researchers acquired the voltages and currents of the three power grid phases:
The three-line voltages were connected directly to the high-voltage inputs (HV, ±2000 V range) of the ultra-high-speed SIRIUSi-HS-4xHV-4xLV chassis.
The three-phase currents were measured using ultra-high-precision Dewesoft DC-CT-1000I-S22DA transducers based on patented closed-loop Platiše Flux Sensor (PFS) technology. These industrial-grade sensors offer an accuracy of ±0.02% FS (total error <200 ppm), an ultra-low standby power consumption of just 0.56 W, and a bandwidth from DC to 1 MHz (-0.5 dB), eliminating thermal drift and offset errors typical of traditional Hall-effect sensors. [1]
Monitoring welding arc current on the DC side
The key signal for calculating the MGWC, the arc direct current, was monitored non-invasively by clamping the torch ground cable with a DS-CLAMP-300DC Hall-effect current clamp (±300 A range, bandwidth up to 20 kHz).
Synchronized vibration, acoustic, and temperature measurements
To comprehensively characterize and analyze the mechanical, acoustic, and thermal behavior of the process, the researchers paired an industrial IOLITE-6xSTGmodule with the high-speed SIRIUS® chassis.
Thanks to this multichannel signal conditioning module, it was possible to implement a microsecond-synchronized Sensor Fusion strategy via EtherCAT bus:
Accelerometer (with Displacement Calculation): Positioned at critical points of the deposition system to acquire structural mechanical vibrations. The accelerometer signal was processed in real time directly within DewesoftX.
Microphone: Dedicated to acquiring the acoustic signature generated by the CMT arc (e.g., spatter).
Pyrometer: Used to monitor the interpass temperature.
Optris PI 640i Thermal Camera: Directly interfaced to record the 2D thermal map (and generate a 3D temperature profile) of the heat-affected zone (HAZ), essential for mapping the cooling rate and preventing cracks or residual metallurgical stress.
Video camera: Enables frame-by-frame visual validation, synchronized with software to analog signals and the WC indicator. In the event of an alarm or a sudden drop in MGWC, the operator can scrub back through the recording to observe the exact physical dynamics of the filler droplet at that precise millisecond.
Synchronized data acquisition and visualization with DewesoftX
All AC and DC channels, along with the multi-domain physical sensors, were synchronously sampled and recorded using DewesoftX software.


Experimental results: Detecting WAAM process instability
The experimental campaign involved performing 11 single-bead deposition tests on steel plates:
Tests 1 to 9: Conducted by varying parameters within a safe process window.
Tests 10 and 11: Conducted by intentionally forcing incorrect parameters to induce instability and discontinuous beads.


The results confirmed the remarkable sensitivity of the MGWC indicator developed within the measurement framework:


Perfect Deposits (Group 1 - ST 1 to 6): Metallographic and visual examinations revealed geometrically flawless, defect-free beads. The arc current faithfully tracked the reference model, yielding MGWC values consistently above 0.95 with negligible uncertainty.
Intermediate Deposits (Group 2 - ST 7–9): Characterized by micro-instabilities and brief downward current dips caused by variations in CTWD or gas flow rate. The beads remained continuous, but the MGWC dropped into a "warning" zone between 0.8 and 0.9.
Defective Deposits (Group 3 - ST 10–11): Operating outside the process window, the current exhibited chaotic behavior. The MGWC indicator plummeted below 0.5, instantly highlighting the macroscopic instability of the weld pool.
Evaluating measurement uncertainty and defect detection reliability
In high-value-added industries (such as aerospace), a quality indicator cannot be a mere empirical estimate: it must be associated with a quantifiable metrological uncertainty in compliance with international guidelines (GUM).
The research team calculated the uncertainty of the MGWC parameter by propagating the acquisition system specifications (Hall current sensor accuracy, ADC resolution, thermal noise, and positional sensitivity) via a Monte Carlo simulation with 10,000 iterations.
The results show that the expanded uncertainty of the MGWC parameter (, 95% confidence level) is extremely low (ranging between 0.011 and 0.021). This means that the MGWC intervals associated with compliant and non-compliant builds remain clearly separated even in the worst-case metrological scenario, reducing the risk of false positives or missed detections to zero.
Reducing energy consumption and material waste in WAAM
Detecting CMT electric arc instability within the first few seconds of deposition enables either closed-loop control or immediate termination of the printing process.
The research team quantified the economic impact of this early shutdown by analyzing the active energy absorbed by the three-phase AC system. The active power draw during stable tests averaged approximately 4.5 kW (with an average consumption of around 30 Wh for just 20 seconds of deposition).
Extrapolating these figures to large-scale builds lasting dozens of hours, it is evident how immediately halting a non-compliant process enables significant savings in:
Electrical energy
By cutting off power upstream of the arc-welding power source.High-value materials
By stopping the feed of expensive wire feedstock (e.g., specialty steels, nickel alloys, or titanium).Shielding gas
By shutting off the flow rate and avoiding the waste of argon or CO2 mixtures.
Conclusion: advancing real-time WAAM quality monitoring
The collaborative effort between the University of Naples Federico II, Universitas Mercatorum, and Dewesoft Italy has demonstrated that non-invasive electrical metrology, supported by intelligent time-frequency algorithms and integrated into a multi-domain sensor network coordinated by IOLITE, is the cornerstone for transforming WAAM metal 3D printing from an experimental technology into a mature, repeatable, and certified industrial process.
The next step in the research? Extending the methodology to multilayer depositions and long-duration processes by introducing an adaptive reference waveform and integrating the MGWC indicator into closed-loop control strategies.
In parallel, the development of a multi-sensor monitoring system is underway, based on the synchronization of electrical, vibrational, acoustic, and thermal measurements, to achieve a more comprehensive characterization of the WAAM-CMT process.
References
G. de Alteriis, A. T. Silvestri, E. Viola, M. Ribichini, A. Squillace, and A. Liccardo, “Electrical Current Measurements for Process Monitoring in Wire Arc Additive Manufacturing,” IEEE Trans. Instrum. Meas., 2026, doi: 10.1109/TIM.2026.3697076