




Building a High-Fidelity Road Database for Traffic-in-the-Loop Automotive Simulation
Elia Grano and Zihao Guo
IEHV Research Group, Polytechnic University of Turin
September 1, 2026
Standard laboratory drive cycles cannot fully reflect the complexity of real-world driving. This can limit the accuracy of vehicle simulations and emissions analysis.
To create more realistic test scenarios, researchers at the IEHV Group at the Polytechnic University of Turin developed a high-resolution road data acquisition and processing workflow for their MATLAB-based Traffic-in-the-Loop (M-TIL) simulation platform.
Using Dewesoft GNSS/IMU instrumentation and detailed road annotation, the team built a database of more than 1,300 real road and intersection elements. M-TIL uses this data to generate realistic, RDE-compliant driving routes for automotive simulation, research, and validation.
Why Real-World Road Data Matters for Automotive Simulation
The Innovative Electric and Hybrid Vehicles (IEHV) Group is part of the Department of Mechanical and Aerospace Engineering (DIMEAS) at the Polytechnic University of Turin, Italy. Founded in 2013 by Prof. Massimiliana Carello, the group works on applied mechanics, autonomous driving, battery and fuel cell modeling, and advanced vehicle dynamics. It also contributes to regional and European automotive research projects.
Standardized driving cycles such as the Worldwide Harmonized Light Vehicle Test Procedure (WLTP) play an important role in vehicle certification. However, laboratory cycles cannot fully reproduce the conditions drivers experience on real roads.
Factors such as road gradient, traffic density, intersections, and driving behavior constantly change in everyday driving. As a result, fuel consumption and emissions measured during standardized tests can differ significantly from real-world results [1].
The European Commission introduced Real Driving Emissions (RDE) testing to help close this gap [2]. RDE requires vehicle emissions to be measured on public roads under defined driving and environmental conditions.
However, real-road testing introduces another challenge. Researchers also need controlled and repeatable scenarios to compare vehicle models and control strategies consistently. A single RDE route cannot represent the full range of conditions vehicles may encounter in real-world driving [3].
Research from the ICCT has shown that differences between official and real-world fuel consumption and CO₂ emissions occur across major automotive markets, as illustrated in Figure 1 [4].
This creates a need for automotive simulation methods that combine the realism of measured road data with the repeatability and flexibility of simulation.


To address this need, researchers at the IEHV Group developed the MATLAB-based Traffic-in-the-Loop (M-TIL) platform. Its architecture is shown in Figure 2.
M-TIL creates complete driving scenarios by combining real-world road segments stored in a dedicated database. Each segment contains information such as road geometry, elevation, curvature, speed limits, and intersection topology.
A stochastic algorithm selects and connects these segments to create routes that meet RDE requirements while remaining geometrically consistent and physically drivable. This approach allows researchers to generate a wide variety of realistic driving scenarios for vehicle simulation and validation.
The accuracy of these simulations depends heavily on the quality and detail of the underlying road database. In particular, M-TIL requires high-resolution spatial data to accurately reproduce road geometry and calculate parameters such as curvature.
Commercial map services can provide road coordinates, but their spatial resolution is generally too low for this purpose. Accurate road-curvature calculations require GPS points spaced only a few meters apart [5], a level of detail that standard map exports do not provide.
For this reason, the researchers chose to measure real roads directly, creating the high-resolution dataset needed for automated and geometrically accurate scenario generation.


High-resolution GNSS/IMU road data collection and processing
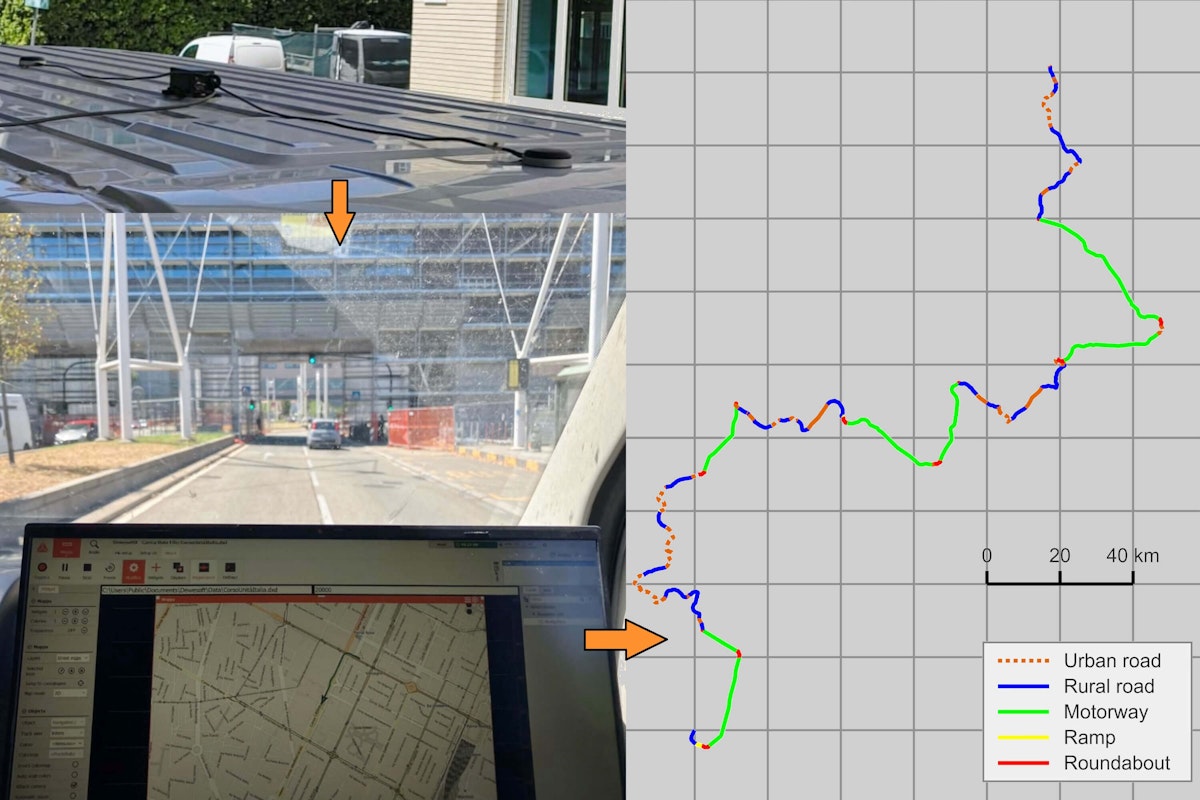
The road data collection campaign was carried out with support from Dewesoft d.o.o., which provided a Navion i2 inertial navigation system (INS) for the measurements. Figure 3 shows the complete data acquisition setup.
Collecting 400 km of real-world road data
The Navion i2 was mounted magnetically on the roof of a van to provide an unobstructed view of the sky. It was connected to a laptop via LAN, while DewesoftX data acquisition software was used to configure the system, monitor the measurements in real time, and continuously store the recorded data.
Over two days, the team covered approximately 400 km around Turin, including urban roads, rural roads, motorways, and ramps.
Real-time visualization in DewesoftX helped verify GNSS signal quality throughout the campaign. It also allowed the researchers to identify areas affected by weaker satellite reception, particularly streets surrounded by tall buildings or dense vegetation. These sections could then be prioritized for manual review during post-processing.


Processing GNSS data for road curvature and grade
The Navion i2 recorded data at 100 Hz. During post-processing, the dataset was down-sampled to a uniform spacing of 2 m between points.
This provided sufficient spatial resolution for calculating road curvature and grade while keeping the dataset manageable. It also removed near-duplicate points recorded when the vehicle was stationary.
Road curvature was calculated from the recorded coordinates using standard differential-geometry methods [5], while road grade was derived from the corrected elevation profile.
Latitude, longitude, and elevation data were converted into local Cartesian coordinates using an equirectangular projection [6]. The curvature and grade signals were then smoothed to reduce residual GNSS noise while preserving the main geometric features of the road.
The team also corrected measurement errors caused by challenging GNSS conditions. Multipath effects from buildings could introduce sudden changes in the elevation profile, while temporary signal loss in areas such as underpasses could create lateral position errors. These affected points were corrected using reliable coordinates recorded before and after the disturbed section.
Figure 4 shows the roads covered during the measurement campaign. The left-hand map separates urban roads, rural roads, motorways, and ramps, while the right-hand map shows the corresponding road elevation.


Classifying roads and intersections
Each recorded point was assigned a road type based on physical road signs observed during the drive and classified according to the RDE road categories.
The researchers also added a secondary classification to distinguish road environments in more detail, such as major urban roads, minor streets, and roads through smaller towns.
Intersection geometry was identified by overlaying the measured GNSS track on a cartographic reference. Intersections were divided into two main types:
Single-Point Intersections (SPI) for simple junctions
Multiple-Point Intersections (MPI) for larger areas such as traffic lights, roundabouts, and stop or yield locations
For MPI locations, individual points were further classified according to their role in traffic flow. Injection points indicate where simulated vehicles can enter the ego vehicle’s road, while ejection points identify where vehicles can leave it.
The researchers also recorded the type of traffic control and the road type and category of each intersecting road. This information allows M-TIL to simulate more realistic interactions with surrounding traffic.
The high spatial resolution of the Navion i2 measurements was particularly important for this step. The original 100 Hz GNSS/IMU data provided a dense point cloud, while the processed 2 m point spacing was sufficient to identify intersection boundaries and road geometry clearly.
Figure 5 illustrates how road segments and intersections are separated within an urban route.


Building the M-TIL road database and generating RDE-compliant routes
The data acquisition pipeline benefited greatly from DewesoftX's capabilities, which proved to be a powerful and versatile platform for handling heterogeneous on-road data streams.
As illustrated in Figure 6, the software simultaneously records and visualizes multiple physical channels, including body-frame velocity, pitch, roll, heading, and raw GNSS altitude, while overlaying the vehicle's live GPS track on an interactive map.
This tight integration of multi-channel signal logging and real-time navigation display within a single environment significantly streamlined post- processing: all channels share a common time base, and data segments of interest can be identified spatially before any offline analysis begins, reducing both effort and the risk of synchronization errors in subsequent stages.
Some data manipulation must be performed. First, latitude, longitude, and elevation coordinates are converted into local Cartesian coordinates in the x, y, and z axes with the equirectangular projection [6] as shown in Equation.
where:
𝑥 is the local x-axis vector.
𝑦 is the local y-axis vector.
𝑧 is the local elevation vector.
𝜆 is the longitude vector.
𝜆1 is the first element of the longitude vector.
𝜑 is the latitude vector.
𝜑1 is the first element of the latitude vector.
𝑍 is the global elevation vector.
𝑍1 is the first element of the global elevation vector.
𝑅 is the Earth radius, equal to 6371 km.
Once the conversion to Cartesian coordinates is complete, road curvature can be calculated. Thanks to the dense point cloud provided by the 100 Hz sampling rate of the Navion i2, which yields a 2 m inter-point spacing sufficient to resolve intersection geometry at pedestrian-crossing scale, the calculation is based on Equation obtained from [5].
where:
𝜚 is the signed curvature vector.
𝑥 is the local x-axis vector.
𝑦 is the local y-axis vector.
𝑠 is the cumulative distance vector.
The database comprises one folder for each road type. Within each, a dedicated folder is created for each category. Each combination of road type and category, therefore, has its own specific folder. Within each, two repositories are created, one for collecting intersection link files and the other for road link files.


Key information is encrypted in the file’s name, so that it is not necessary to load all the files in memory to decide which to pick during scenario creation. The naming convention differs between intersection links and road links.
The name of the road link files, containing their lengths and absolute elevation changes. The name of the intersection link files contains their length, type (traffic light, roundabout, etc.), whether they are SPI or MPI, and the road type and category they allow connection to. Ramp file names, which are an exception to the road link naming convention, contain information about their length, road type, and the categories of their origin and destination. The database structure and the total number of files are specified in Table 1.
| Road type | Road links | Intersection links | Total |
|---|---|---|---|
| Urban major | 206 | 229 | 435 |
| Urban minor | 29 | 22 | 51 |
| Urban town | 125 | 113 | 238 |
| Rural major | 99 | 87 | 186 |
| Rural minor | 9 | 7 | 16 |
| Motorway major | 190 | 197 | 387 |
| Ramp | 6 | — | 6 |
| Total | 664 | 655 | 1,319 |
The completed labeling and segmentation process produced a database of 1,319 road and intersection elements, organized by road type and category in a structured directory that the M-TIL scenario generation algorithm queries at runtime.
Each file encodes key attributes in its filename, including length, road type, and elevation change for road links, and length, intersection type, SPI/MPI classification, and connected road categories for intersection links, so that the generation algorithm can select appropriate segments without loading every file into memory.
With this database in place, M-TIL can generate geometrically consistent and statistically representative driving routes of arbitrary length and composition, providing a rigorous and flexible environment for automotive simulation and validation research.
The M-TIL scenario generation algorithm assembles road segments from the database into complete driving routes by iteratively selecting and stitching segments according to a set of probabilistic rules.
Route generation always begins on an urban segment, as prescribed by RDE regulations. At each step, the algorithm decides whether to continue the current road type or switch, and selects the next segment based on how far the current route composition deviates from the target proportions.
Logical connectivity constraints prevent unrealistic transitions, and ramp segments are inserted automatically at every motorway entry and exit. Each new segment is geometrically aligned to the endpoint of the existing route to ensure positional and tangential continuity.
An example of a generated route is shown in Figure 7. Urban, rural, motorway, and ramp segments are represented in orange, blue, green, and red, respectively. The resulting route satisfies the RDE compositional requirements, comprising approximately 34% urban, 33% rural, and 33% motorway driving, with each road type exceeding the minimum 16 km threshold.


Real-world road data for more realistic automotive simulation
The collaboration between the IEHV Group and Dewesoft showed how high-frequency GNSS measurements and integrated data acquisition software can provide the spatial resolution needed for realistic road modeling.
The project produced a database of 1,319 annotated road and intersection elements, giving the M-TIL platform a real-world foundation for generating realistic, RDE-compliant driving scenarios of virtually any length and composition.
Unlike commercial map data, the measured dataset provides the detail required to reproduce road geometry, elevation, curvature, and intersection structures with sufficient accuracy for automotive simulation and validation.
The database can also be expanded over time as new cities, road types, and research requirements are added, making it a scalable foundation for future Traffic-in-the-Loop studies.
References
G. Fontaras, N.-G. Zacharof, B. Ciuffo, "Fuel consumption and CO2 emissions from passenger cars in Europe: Laboratory versus real-world emissions," Progress in Energy and Combustion Science, vol. 60, pp. 97-131, 2017.
J. Dornoff, V. Valverde Morales, and U. Tietge, “On the way to 'real-world' CO2 values? The European passenger car market after 5 years of WLTP”, Jan. 2024. Accessed: Oct. 27, 2025. [Online].
J. Claßen, S. Krysmon, F. Dorscheidt, S. Sterlepper, and S. Pischinger, “Real Driving Emission Calibration—Review of Current Validation Methods against the Background of Future Emission Legislation”, Appl. Sci., vol. 11, no. 12, p. 5429, Jan. 2021, doi: 10.3390/app11125429.
U. Tietge, S. Díaz, Z. Yang, and P. Mock, “From laboratory to road international: A comparison of official and real-world fuel consumption and CO2 values for passenger cars in Europe, the United States, China, and Japan”, May 2017.
R. Goldman, “Curvature formulas for implicit curves and surfaces”, Comput. Aided Geom. Des., vol. 22, no. 7, pp. 632–658, Oct. 2005, doi: 10.1016/j.cagd.2005.06.005.
“Equirectangular projection”, Wikipedia. Aug. 31, 2025. Accessed: Nov. 22, 2025. [Online].