




Industrial Robot Energy Efficiency: How Motion and Speed Affect Energy Consumption
Kevin Lindlaan
Tallinn University of Technology
September 2, 2026
How much energy does an industrial robot use, and how do motion strategy and operating speed affect its efficiency?
This study investigates the energy consumption of a KUKA SCARA robot during sequential and simultaneous joint movements. Motor current, voltage, power, and cumulative energy are measured using Dewesoft high-speed power analysis and synchronized data acquisition. The results show how different motion patterns and speed settings influence robot energy consumption and provide measurement data for validating dynamic simulation models.
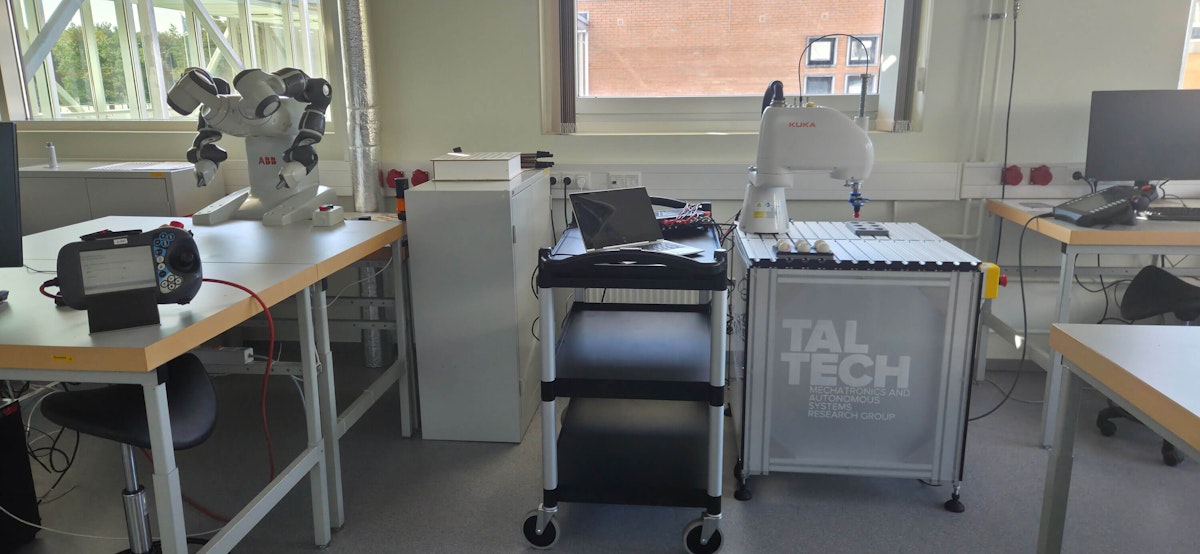
Industrial robot energy consumption and efficiency
Industrial robots play an essential role in modern manufacturing, improving precision, repeatability, productivity, and process flexibility. They are widely used for automated tasks such as assembly, material handling, and inspection.
As industrial automation expands, energy efficiency is becoming increasingly important. Rising energy costs and sustainability requirements are encouraging manufacturers to better understand how robots consume energy under different operating conditions.
Robotic systems are also valuable in research and engineering education. Combining physical robots with simulation models helps students and engineers study motion control, system dynamics, and the behavior of mechatronic systems.
Understanding how energy consumption changes with different movement patterns is important for both practical applications and simulation. These measurements can reveal more energy-efficient motion strategies and provide the data needed to improve robot models.
Accurate dynamic models often require parameters that manufacturers do not fully provide. Experimental measurements are therefore necessary for analyzing real robot behavior and validating simulations.
This study examines the energy consumption of a KUKA SCARA robot under different motion patterns and operating speeds.
Measuring energy efficiency under different robot motions
The goal of the measurements is to understand how different motion patterns and operating conditions affect the robot’s energy consumption.
The study compares two strategies: activating the motors individually and operating them simultaneously. By measuring the energy used in each case, the results can indicate which movement strategies are more efficient under specific operating conditions.
The collected measurement data can also be compared with simulation results to evaluate and validate the robot’s dynamic model.


Industrial robot power measurement setup
Two experimental robot programs were created, each using a different motion sequence. A digital output from the robot controller was used to trigger the measurements, allowing signals from the individual motors to be synchronized.
Custom cable extensions provided access to the motor phase conductors for voltage and current measurements.
The measurement system used a Dewesoft SIRIUSi-HS data acquisition device. Three high-voltage (HV) channels measured the motor phase voltages, while three low-voltage (LV) channels measured phase currents through DS-CLAMP-15AC current clamps. An additional high-voltage input was used to trigger the start and stop of each measurement.
The sampling rate was set to 1 MHz to capture the high-frequency PWM signals of the motor phase voltages.
Figure 2 and Table 1 provide a complete overview of the measurement setup.


| Type | Product | Description |
|---|---|---|
| Data acquisition system | SIRIUSi-HS-4xHV-4xLV+-8xAO-EDU | USB DAQ system for measuring motor phase voltages and currents |
| Sensor | DEWESOFT DS-CLAMP-15AC (10 A/V) | Measurement of motor phase currents |
| Devices | KR6 R500 Z200-2 | KUKA SCARA robot |
| KRC5 micro | Robot controller | |
| Other | Motor cable extensions | Provides access to motor phase conductors |
| Software | DewesoftX | Data acquisition, visualization, and analysis |
| Power Analyzer Plugin | Module for analyzing motor power consumption |
Energy efficiency test methodology
I developed two experimental programs in which the robot follows a predetermined path. In the first program, only one motor is activated at a time, while in the second, all the motors operate simultaneously. By comparing these approaches, one can evaluate how different actuation strategies affect overall energy consumption and identify more energy-efficient movement patterns.
In both experiments, the motors followed the same motion sequence. The rotational robot axes moved through the positions 0° → −90° → 90° → 0°. The third linear axis followed a different trajectory: 64 mm → 34 mm → 94 mm → 64 mm.
The phase voltages and currents of all four motors were measured during the experiments at two different speed override settings using the DewesoftX software package. The recorder captured the following data:
Motor phase voltages
All the motor phase voltages - measured through high-voltage inputs.
Motor phase currents
All motor phase currents - recorded using AC clamps via low-voltage inputs.
Motor input power
Motor powers - computed with the Dewesoft Power Analyzer plugin through measured phase voltages and currents
To analyze the experimental data, I used three recorders: one to monitor phase currents, one to monitor phase voltages, and one to record input power. Additionally, I implemented a text box to capture experiment-related information.
To analyze the data and visualize all motor signals in a single graph, I exported the measured data to a text file and subsequently imported it into MATLAB. This procedure allowed the motor’s data to be synchronized on a single plot and enabled further calculations.


How motion and speed affect robot energy consumption
Four experimental runs were conducted to compare the effect of motion strategy and operating speed on energy consumption. The robot was tested at 10% and 30% speed override using both sequential and simultaneous joint movements. A 30% speed override was the maximum safe setting for the test setup.
Figures 4 and 5 show the measured motor phase currents at 30% speed override. Motors 1 and 2 draw the highest currents because they are larger and move most of the robot’s mass. Motors 3 and 4 show lower current levels because they are smaller and operate under lighter loads.
Figure 4 also shows small corrective movements in the other robot joints during motion. These corrections are most likely caused by the control algorithm maintaining the end-of-arm tooling setpoint.


Figures 6 and 7 show the measured motor phase voltages during the same experimental motion. The switching frequency of these PWM signals is 16 kHz.


Figures 8 and 9 show the measured motor power during both experimental programs at a 30% speed override. The graphs make it possible to compare how much power each motor consumes throughout the robot’s motion.
In both experiments, Motors 1 and 2 consume the most power, particularly during active movement. Motors 3 and 4 consume significantly less power because they operate under lighter loads.
In the first experiment, Motor 3 also consumes some power while Motor 4 is moving. This is most likely because Motor 3 must actively maintain its position while the other joint moves.


Figures 10 and 11 show the cumulative energy consumption for both experiments at a 30% speed override. The graphs show how much energy each motor uses over time and how this contributes to the robot’s total energy consumption.
In both experiments, Motors 1 and 2 account for most of the energy use, while Motors 3 and 4 contribute a smaller share.
The total energy curves also show that the first experiment consumed less energy than the second under these test conditions.


Across all graphs, the motor movements appear as distinct cycles. The central segment lasts the longest because it represents the longest movement path.
At higher operating speeds, current peaks occur at the beginning of each movement as the motors accelerate from standstill. At lower speeds, these peaks are less pronounced, and the current changes more gradually.
Table 2 summarizes the cumulative and total energy consumption for all four experiments. It also shows how much each motor contributes to the total energy use, both in absolute values and as a percentage of the total.
|
Total [Ws] |
Motor 1 [Ws] |
Motor 2 [Ws] |
Motor 3 [Ws] |
Motor 4 [Ws] |
||||||
|
Ws |
% |
Ws |
% |
Ws |
% |
Ws |
% |
Ws |
% |
|
|
Experiment 1 V=10% |
169.26 |
100 |
84.68 |
50.03 |
64.64 |
38.19 |
17.05 |
10.07 |
2.89 |
1.71 |
|
Experiment 1 V=30% |
172.85 |
100 |
90.92 |
52.60 |
61.81 |
35.76 |
17.30 |
10.01 |
2.82 |
1.63 |
|
Experiment 2 V=10% |
157.97 |
100 |
83.03 |
52.56 |
55.16 |
34.92 |
16.85 |
10.66 |
2.93 |
1.86 |
|
Experiment 2 V=30% |
184.69 |
100 |
93.89 |
50.84 |
72.57 |
39.29 |
15.68 |
8.49 |
2.54 |
1.38 |
The experiments do not show that one motion strategy is consistently more energy-efficient than the other. Instead, the results indicate that the effect of the movement pattern depends on the robot’s operating speed.
Operating speed also appears to have a stronger influence on total energy consumption than motion duration. In both experiments, the robot used less energy at the lower speed, even though the movements took longer to complete.
The measurements further suggest that differences between motion strategies may become more noticeable at higher speeds. However, the available test results are not sufficient to confirm this trend conclusively.
Key findings on industrial robot energy efficiency
This study analyzed the energy consumption of a KUKA SCARA robot under different motion patterns and operating speeds. The results show that motion strategy affects energy use, but neither sequential nor simultaneous movement was consistently more efficient. The outcome depends strongly on the operating conditions, especially speed.
Motors 1 and 2 accounted for most of the total energy consumption because they move the largest loads. Motors 3 and 4 contributed a much smaller share.
Higher operating speeds produced larger current peaks and greater overall energy consumption. At lower speeds, current changed more smoothly and the robot used less energy, even though the movements took longer to complete. This indicates that operating speed had a greater effect on energy consumption than motion duration in these tests.
The collected measurement data will also support the development and validation of a MATLAB-based dynamic robot model. Comparing simulated results with experimental measurements will make it possible to evaluate how accurately the model represents the real system.
Overall, the results show that both motion strategy and operating speed should be considered when evaluating and optimizing industrial robot energy efficiency.
References
"IFR," 22 January 2025. [Online].