




Calculating Hydrogen Fuel Consumption from ECU Data in a Ford V6 Engine
Jon Theys
Catholic University of Leuven
September 1, 2026
HydroTeam developed a non-invasive method to estimate hydrogen fuel consumption on a Ford 3.5L V6 engine using data already available from the engine control unit (ECU). ECU signals were acquired through a Dewesoft DS-CAN2 interface and analyzed in DewesoftX. By combining intake manifold data, lambda values, and the ideal gas law, the team calculated hydrogen mass flow in real time without using a dedicated fuel flow meter. Initial testing confirmed the feasibility of the approach while highlighting opportunities to improve accuracy with wider-range lambda sensors and dynamic volumetric-efficiency modeling.
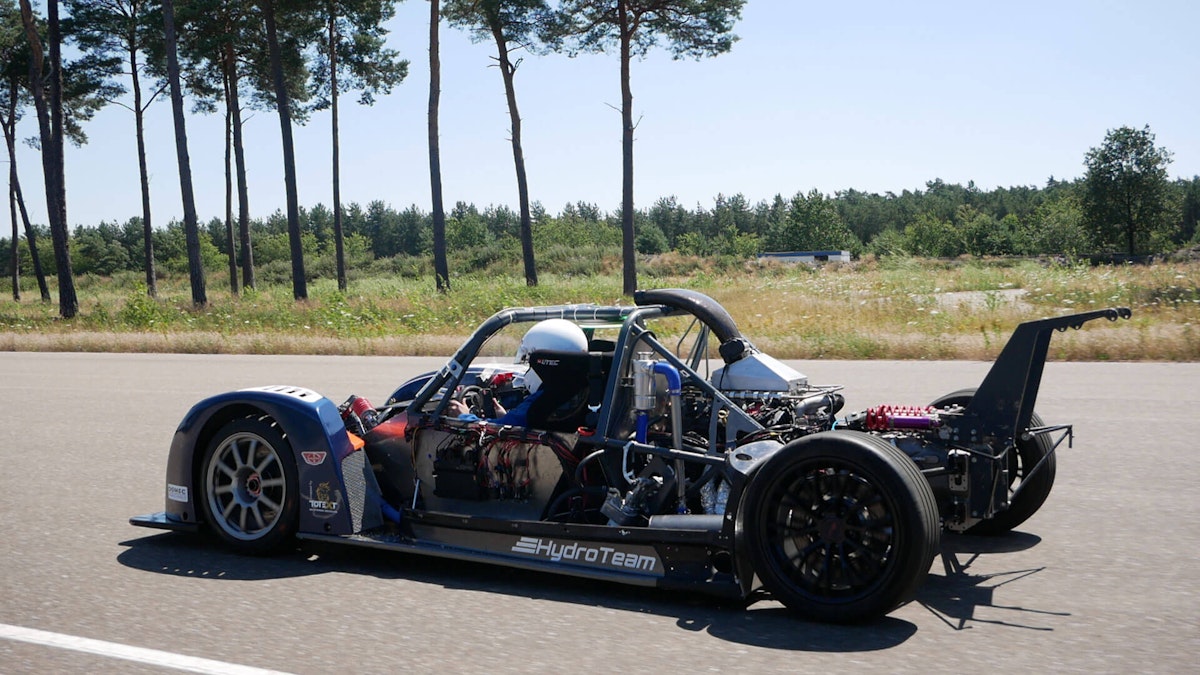
HydroTeam’s hydrogen V6 race car project
HydroTeam is a student-led racing and research initiative at KU Leuven developing a hydrogen-powered race car. Unlike many hydrogen motorsport projects that use fuel cells, HydroTeam is developing a hydrogen internal combustion engine (H₂-ICE) based on a V6 engine.
The team plans to test a working prototype on track in Q2 2026. This prototype will help validate the vehicle’s systems, controls, safety architecture, and overall performance as HydroTeam works toward its long-term goal of competing in the 24 Hours of Le Mans by 2030.
KU Leuven is the largest university in Belgium and the Low Countries, with more than 65,000 students, around 21% of whom are international. Its main campus is in Leuven, approximately 30 kilometers from Brussels, with additional campuses in several other Flemish cities.
Through the project, HydroTeam aims to demonstrate the potential of hydrogen combustion for high-performance motorsport while developing the technology and engineering expertise required for endurance racing.
Calculating hydrogen fuel consumption from ECU data
For this study, HydroTeam analyzed the fuel consumption of a Ford 3.5L V6 hydrogen engine using data already available from the engine control unit (ECU). The signals were acquired through a Dewesoft DS-CAN2 CAN interface and processed in DewesoftX.
Using the DewesoftX Math module, the team combined manifold pressure, intake air temperature, engine speed, and lambda data with the ideal gas law to calculate hydrogen mass flow in real time. Initial unloaded testing produced a maximum calculated hydrogen mass flow rate of 1.07 g/s during transient operation at a throttle position of 12.7%.
Real-time fuel consumption is an important parameter when evaluating an engine because it helps estimate efficiency, operating range, and overall performance. Hydrogen engines are particularly interesting in this respect because hydrogen has a stoichiometric air-to-fuel ratio of approximately 34.3:1, compared with 14.7:1 for gasoline and 14.5:1 for diesel.
Instead of adding a dedicated hydrogen flow meter, the team calculated fuel consumption from ECU data that was already being recorded. This reduces additional instrumentation, weight, and cost while still providing a live estimate of hydrogen consumption.
The initial tests also highlighted areas for further development. Wider-range lambda sensors would improve measurements under very lean operating conditions, while a dynamic volumetric-efficiency model would make the calculation more accurate across different engine speeds and loads.
The challenge: measuring hydrogen fuel consumption without a flow meter
HydroTeam V0 does not have a dedicated hydrogen flow meter to measure fuel consumption directly while the engine is running. Instead, the team uses engine control unit (ECU) data acquired through a Dewesoft CAN interface to estimate the hydrogen mass flow rate.
Two calculation methods were considered. The primary method uses the ideal gas law together with intake and engine data to calculate hydrogen consumption. A second method based on injector duty cycle was intended as an independent check of the calculated results
Hydrogen engine ECU data acquisition setup
To read out the ECU, we established a connection over the CAN bus. CAN, or Controller Area Network, is a communication protocol that consists of two wires, CAN high and CAN low, with a termination resistor at each end to ensure signal integrity.
The CAN communications were accessed using the Dewesoft DS-CAN2. The DS-CAN2 is a dual-channel USB-to-CAN interface that converts CAN bus signals into USB data, enabling data monitoring and analysis.
For this case, a single CAN bus was connected to the DS-CAN2 on channel CAN0 (see Figure 1). We then connected this to a laptop via a USB-A-to-mini-USB cable, selecting a CAN baud rate of 500 kbit/s.


Once connected, we used DewesoftX to analyze incoming signals. Importing the ECU manufacturer's DBC setup file into the Dewesoft CAN module enabled decoding the incoming signals into usable data. From here, we selected the relevant channels for saving and performing calculations. Table 1 shows the most important channels for the initial calculations and diagnostics.
| Key Channel | Calculations and Diagnostics |
|---|---|
| Lambda Average | MAP (Manifold absolute pressure) |
| Lambda A | Intake Air Temperature (IAT) |
| Lambda B | ECU Battery Voltage |
| Throttle Pos | Engine Speed |


We performed testing under unloaded conditions with the driven wheels on the ground. This setup allowed for safe testing of the start-up sequence. Throughout testing, idling was used, and a throttle input of up to 10% was applied. This allowed operation under controlled conditions while avoiding excessive engine speed, yet still enabled diagnostics of parameter behavior.
Measurement and sensor limitations
We wrote off using the injector duty cycle as the fuel consumption calculation method for the time being, because the injector flow rate still needs to be tested for hydrogen. The ideal gas method also has its drawbacks; the first is that the engine's volumetric efficiency is assumed to be constant, which isn’t true; later iterations of this method need an update. Second is sensor saturation. The current lambda sensors on the car are narrowband sensors that saturate at a lambda of 2.4, which is ok when driving but has limitations when idling.
Lastly, there is the start-up time and the transient of certain sensors. For example, the lambda sensors mentioned earlier need to heat up before they start working. Another example is a temperature sensor, which, depending on the gas flow it measures, has a slow rise time.


Calculating hydrogen mass flow using the ideal gas law
We use three main equations to derive the hydrogen mass flow rate: the ideal gas law (1), the volumetric flow rate (2), and the air-fuel equivalence ratio (3).
First, a mass and molar ratio is determined using (3). The AFR stoichiometric ratio is the chemically ideal fuel-to-air mixture, expressed as the mass of air required to combust 1 g of fuel. In the case of hydrogen, this is 34.3 grams of air per one gram of hydrogen.
The equation above yields the molar ratio. Still, we divide all masses by their molar masses to get the molar ratio needed to calculate the total molar mass of the gas mixture.
Using this molar mass, we can find the specific gas constant through:
with
Using (1), (5), (6), and (7), we can find the specific volume; this is the volume required per gram of gas and will be used to convert a volumetric flow rate to a mass flow rate.
Using (2) and (8) yields the mass flow rate of the total gas in g/s:
Converting the total mass flow into the hydrogen mass flow rate, or the fuel consumption rate, is as simple as multiplying the total mass flow by the mass fraction in (4)
We implemented these calculations in DewesoftX. We also integrated the fuel consumption rate over time to determine the total amount of hydrogen consumed during a test.
Analyzing ECU and lambda sensor data in DewesoftX
The lambda sensors were the main limitation in the fuel-consumption calculation. Because they require time to heat up before producing valid measurements, the analysis only used data collected after the sensors reached operating temperature.
As shown in Figure 4, the lambda sensors required approximately 20 seconds to warm up. Before this point, the signal remained near zero, which would incorrectly appear as very high fuel consumption in the calculated results. Once active, the sensors typically approached their upper measurement limit of around 2.4.
Figure 4 also revealed a difference between the lambda values measured on the left and right cylinder banks, identified as Lambda A and Lambda B. To determine whether this difference was caused by unequal injection or by the sensors themselves, the team physically swapped the two lambda sensors.
Comparing the measurements in Figures 4 and 5 showed that the difference followed the sensors after they were swapped. This indicated that sensor sensitivity was the more likely cause rather than a difference in fuel injection between the two banks. For the final calculations, the team therefore used the average of the two lambda measurements, while recognizing that the actual lambda value may differ slightly.


After selecting the valid measurement window, the team filtered the data to reduce high-frequency noise. Possible sources included sensor noise and electrical interference in the data communication.
An averaging filter in DewesoftX was applied consistently across the complete data set. This helped reduce noise while preserving the relationship between signals and avoiding unnecessary distortion of transient events.

The measured parameters showed a clear relationship with calculated hydrogen consumption. Engine speed, lambda, and manifold absolute pressure (MAP) all influenced the resulting fuel-consumption rate. As engine speed increased and operating conditions changed, the calculated hydrogen mass flow also increased. Lower manifold pressure generally corresponded to lower fuel consumption.

Hydrogen fuel consumption test results
The ideal gas law method implemented in DewesoftX provided a non-invasive estimate of hydrogen fuel consumption for the Ford 3.5L V6 engine. The results showed a clear relationship between engine speed and calculated hydrogen mass flow, supporting the validity of the calculation method.
During transient operation, the difference in fuel consumption between idle and peak throttle conditions was approximately 1 g/s. As engine speed increased, hydrogen consumption also increased, which matched the expected behavior of the engine.
The tests also confirmed the limitations of the lambda sensors. The sensors require a warm-up period before producing usable measurements and saturate at a lambda value of approximately 2.4. Measurements near zero during warm-up and values at the 2.4 saturation limit were therefore excluded from the fuel-consumption calculations.
During the analyzed 56.3-second test interval, with the engine revved in first gear, the calculated hydrogen consumption was 19.6 g, corresponding to an average mass flow rate of 0.348 g/s.
The recorded injector duty-cycle data and calculated fuel consumption also allowed the team to partially characterize the fuel injectors. After accounting for the delay in peak fuel consumption, the calculated fuel mass was approximately 51 mg per injection per injector. A complete injector characterization was not possible because injector pressure was not measured, making pressure-dependent injector behavior an important area for future testing.
Real-time hdrogen fuel consumption using ECU data
The test results confirmed that ECU data can be used to estimate hydrogen fuel consumption in real time without a dedicated flow meter. Using a 500 kbaud CAN connection through the Dewesoft DS-CAN2 interface and the ECU manufacturer’s DBC file, HydroTeam recorded the key engine parameters required for the calculation.
With several improvements, the method could be used on HydroTeam V0 and future versions of the car. The first priority is replacing the current lambda sensors with wideband sensors to avoid saturation and improve measurement accuracy. This would also address the sensitivity differences observed between the two sensors during testing.
A second improvement is the implementation of dynamic volumetric efficiency. Instead of assuming a constant value, the calculation could use an experimentally determined lookup table based on engine speed and manifold absolute pressure (MAP).
The team could also validate the calculated fuel consumption using injector duty-cycle data. This would provide an independent check of the results, although the injector flow rate would first need to be measured.
Because the calculation requires relatively little processing power, it could run directly on the vehicle’s onboard computer. This would provide HydroTeam with a real-time estimate of hydrogen consumption, helping determine when to refuel and supporting diagnostic analysis by comparing fuel use with engine power output.
References
Dewesoft. (2025, September 8). DS-CAN2 Technical Reference Manual DS-CAN2 V25-1
Heywood, J. B. (1988). Internal Combustion Engine Fundamentals. McGraw-Hill Education.
Dietsche, K.-H., & Reif, K. (Eds.). (2022). Bosch Automotive Handbook (11th ed.). Robert Bosch GmbH.
Hydro team: Hydrogen race car student team. (2026, May 8).