




Validating an Electric Formula Student Vehicle Dynamics Model With Track Testing
Angelo Cuccurullo, Giuseppe Greco, Angelo Lo Sapio
UniNa Corse racing Team
July 22, 2026
How accurately can a virtual race car model predict real-world performance? To answer this question, the UniNa Corse team validated the dynamic model of its first fully electric Formula Student car by comparing simulation results with high-precision track-test data. Using advanced measurement systems, tire modeling tools, and an iterative validation process, the team significantly improved simulation accuracy, creating a reliable foundation for future vehicle development and performance optimization.
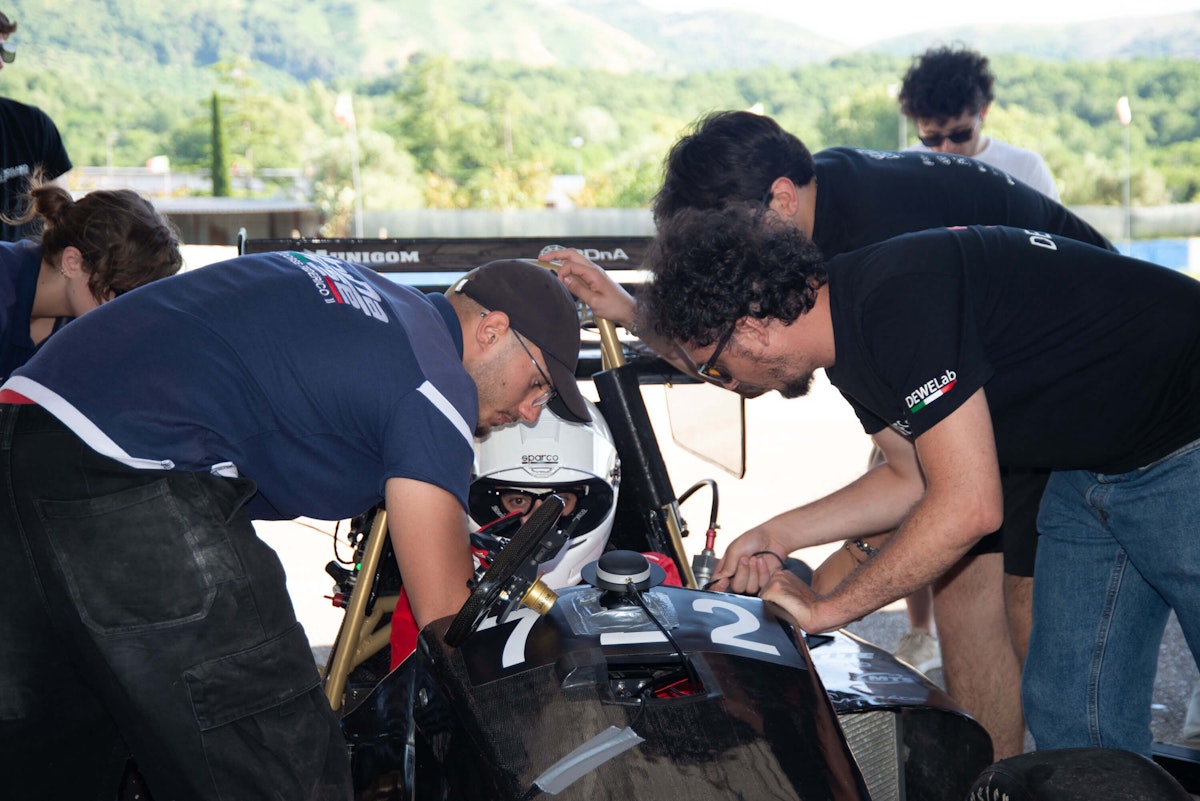
About UniNa Corse
UniNa Corse racing team is the Formula Student team of the University of Naples Federico II. We design, build, and race single-seat prototype racing cars to compete in the international Formula Student competition under the motto "Driven by data. Inspired by speed”.
Our multidisciplinary team develops every aspect of the car — from chassis and aerodynamics to electronics and controls — applying classroom knowledge to real engineering challenges while promoting innovation, teamwork, and continuous improvement.
In the 2024 season, we began developing our first fully electric competing car, which debuted in the 2025 season. As part of this project, we undertook a complete redesign of the car’s kinematic and dynamic systems.
We performed high-precision prototype testing, supported by state-of-the-art Dewesoft equipment, enabling us to accurately compare simulated and real vehicle behavior. Without a reliable simulation, vehicle setup optimization, future kinematic and dynamic development would remain limited. By integrating advanced data acquisition with simulation, we demonstrated how precise model validation drives effective, iterative engineering progress.
In this case study, we focus on tire behavior, which is often the major source of errors in vehicle dynamics simulations.
Gaiola, UniNa Corse’s electric formula student
Formula SAE, also known as Formula Student, is an international engineering design competition originally established by the Society of Automotive Engineers (SAE). It challenges university teams to design, build, and present a racing car, which is then assessed by a panel of experts based on its design, innovation, and overall engineering excellence.
We have been participating in Formula SAE since 2015, initially competing with internal combustion vehicles. In 2021, we expanded our activities by integrating autonomous driving technologies into our cars, the most recent of which is named Gaiola.


In the 2024 season, we began developing our first fully electric vehicle, which competed in the 2025 season. As part of this project, we carried out a complete redesign of the car’s kinematic and dynamic systems. To ensure that this transformation was both safe and effective, and to achieve the highest possible performance, we developed a thorough understanding of the vehicle’s handling behavior.
Table 1 gives a general overview of the car’s specifications.
| Specification | Numerical Value |
|---|---|
| Mass (car+driver) | 330 kg |
| Sprung Mass | 210 kg |
| Unsprung Mass | 50 kg |
| Wheelbase | 1,565 mm |
| Front track | 1,200 mm |
| Rear track | 1,190 mm |
| Wheels | 13” |
| Suspension Type | Pull-rod |
The vehicle dynamics model validation objective
One of our primary objectives for the 2025/2026 season was to validate the car’s dynamic model. Without a properly validated simulation model, we could not reliably use virtual test data to optimize the vehicle setup and enhance its performance. Moreover, this lack of accuracy limited our ability to refine and improve the car's future kinematic and dynamic configurations.
During the 2025/2026 season, we set ourselves an ambitious goal: to design, build, and compete with our first fully electric racing car, marking a decisive leap forward in our innovation and engineering development. To achieve this objective, we conducted a series of track tests and used the collected data to implement and validate our vehicle’s virtual dynamic model.
To reliably compare experimental data with simulation results, we required appropriate Dewesoft equipment and technical expertise. In pursuing this goal, we encountered several challenges — primarily related to the limitations of our existing instrumentation and the need to adopt more advanced technologies and methodologies.
Challenges in correlating simulation and track-test data
Building on these objectives, we quickly realized that the real challenge did not lie in running simulations but in ensuring their credibility. Achieving meaningful correlation between virtual and experimental data required far more than simply collecting measurements; we had to guarantee precise sensor calibration, consistent test procedures, and repeatable driving conditions. Even small discrepancies in data acquisition, environmental variations, or driver input could significantly influence the comparison and compromise the validation process.
Another critical difficulty we faced was managing data quality and synchronization. We needed to accurately time-align and filter high-frequency signals from multiple sensors without compromising their dynamic content. Any noise, signal delay, or measurement uncertainty directly affected the reliability of our model correlation.
Moreover, transitioning to a fully electric platform introduced additional layers of complexity. We had to reconsider modeling assumptions regarding mass distribution, torque-delivery characteristics, and energy-management strategies, and refine parameters that had previously been validated across different vehicle architectures.
Ultimately, the challenge extended beyond technical adjustments. It required us to strengthen our internal workflow, improve cross-team coordination between simulation and testing groups, and adopt a more structured validation methodology. Only by addressing these aspects could we transform raw data into actionable insight and ensure that our dynamic model became a truly reliable engineering tool.
Vehicle dynamics testing and simulation workflow
Our approach is based on an iterative process: simulations are used to test and optimize different configurations until we identify the best setup for our conditions. However, for this process to be truly effective, the simulation model itself must be validated — in other words, it needs to mirror real-world behavior as closely as possible.
For this reason, the team set the objective of validating the model through on-track testing, following a structured procedure (see Figure 2).


After conducting these tests, the data obtained from simulations have to be compared with those recorded on track, taking into account several key factors, such as measurement accuracy, environmental conditions, and driver behavior.
Tire model development and validation
The primary source of error in the team's vehicle dynamics model is the accuracy of tire behavior simulation. The tires generate contact-patch forces that significantly influence the vehicle’s dynamic response. The tire contact patch is the area of a tire’s tread that touches the surface when the tire is pressed against it. As the forces on a tire change, the tire contact patch also changes.
We conducted the study of tire behavior in collaboration with Megaride, the UniNa vehicle dynamics research group, and Dewesoft, which provided a NAVION® i2 Inertial navigation system (INS) and a portable USB-based Controller Area Network (CAN) bus interface and analyzer, DS-CAN 2.


This partnership enabled the acquisition of high-quality experimental data through on-track testing, aimed at generating a .tir file that accurately describes the tire’s performance in simulation. The .tir file contains detailed, tire-specific parameters that enable the implementation of Pacejka Magic Formula, a mathematical model used to calculate the grip forces generated by the tire under various dynamic conditions.
We divided the process of generating the grip forces into four main phases:
Outdoor Testing Routine: We perform specific track maneuvers to capture the vehicle's real-world physical limits
Data Acquisition: High-frequency signals (accelerations, speeds, slip angles) are acquired through Dewesoft instrumentation via the vehicle's CAN bus.
Calculation phase: Tire forces were estimated for specific maneuvers using T.R.I.C.K., a Megaride tool based on an 8-DOF (degrees of freedom) vehicle model. The tool processes experimental signals from the vehicle CAN (Controller Area Network) bus and additional sensors to estimate lateral slip angles and generate virtual telemetry containing force and slip data.
Identification phase: The results from T.R.I.C.K. were used to populate the .tir file via RIDElab, another Megaride tool. RIDElab enables real-time fitting of the Pacejka Magic Formula to experimental data, optimizing the model parameters to minimize the error between simulated and measured tire forces.
Formula Student test instrumentation
Clean, highly accurate data acquisition is essential for feeding our tire model evaluation. Dewesoft's state-of-the-art measurement equipment provided the foundation for our high-precision prototype testing.
In line with the methodology, it is essential to ensure that the data collected during track testing are as clean and accurate as possible. The vehicle’s lateral and longitudinal accelerations during dynamic maneuvers represent key inputs for the T.R.I.C.K. tool.
Additionally, precise vehicle positioning data enables a more effective comparison between actual vehicle behavior and the simulated response based on driver inputs.
Table 2 details the complete vehicle instrumentation layout.
| Measurement Value | Sensor/ Instrument | Key Specifications | Conditioning/ Acquisition |
|---|---|---|---|
| Shock Absorber Travel | Linear Potentiometers (DIA9.5-xx / ELPM series) | IP67 protection, >25 million cycles mechanical life, $\le\pm0.5\%$ linearity | 5V analog input |
| Wheel Speed | Contrinex Inductive Sensor | 10-30 VDC supply, 0.5-1.0 mm precise gear tooth gap | Counter input |
| Steering Angle | Linear Potentiometer | High-resolution conductive plastic | 5V analog input |
| Brake Pressure | SPxx Piezoresistive Transducer | AISI 316 L stainless steel, 0.5-4.5V ratio-metric output, up to 300 bar overpressure | Voltage input |
Proper installation is crucial to avoid measurement artifacts. For instance, the Navion IMU measures acceleration at its exact mounting point; to prevent errors caused by offset from the center of gravity, the unit must be placed as close to the vehicle's true CG as possible, and axis misalignment must be mathematically corrected during post-processing.
In Figure 5, the optical sensor is securely mounted on the vehicle's side structure to enable direct, slip-free measurement of longitudinal and transverse speeds, as well as the vehicle's lateral slip angle, during dynamic cornering.

Figure 6 shows the Navion i-2 Inertial Navigation System (INS) and the multi-channel DS-CAN 2 interface, rigidly mounted as close as possible to the vehicle's center of gravity. This fixation minimizes offset errors in the acceleration readings.


Figure 4 shows one of the Navion dual antennas we mounted on the vehicle's nose to ensure a clear line of sight to satellites for RTK-corrected, centimeter-level positioning.
The following tools were fundamental to the successful execution of the tests:
NAVION by Dewesoft is a compact, high-performance inertial navigation system that fuses GNSS and MEMS sensor data via a Kalman filter. With dual antennas and RTK correction, it delivers up to 1 cm positioning accuracy.
DS-CAN 2 by Dewesoft is a multi-channel USB CAN system with CAN bus software supporting OBDII, J1939, XCP/CCP, CAN transmission, and DBC files.
Correvit S-Motion optical sensors enable direct, slip-free measurement of longitudinal and transverse speed, as well as lateral slip angle, in vehicle dynamics testing.


Track-test validation methodology
The physical track testing campaign was conducted at the Circuito Internazionale Del Volturno, which features long straights, constant-radius corners, and mixed sectors, providing an optimal environment to evaluate wide operating ranges. To accurately characterize individual tire parameters, we executed two localized testing routines to capture pure physical limits:


To isolate specific tire behaviors and feed clean data into the Pacejka Magic Formula, we separated our track runs into two standardized procedures:
Pure longitudinal slip test
This test is designed to characterize the tire's grip and slip ratio under pure acceleration and braking.
Procedure: The driver drives the vehicle in a straight line. Once stabilized, the driver applies high torque (near saturation) to induce wheel slip.
Recorded data: Wheel speed, Vehicle speed, Motor torque, and Longitudinal acceleration
Computation: The data allows us to compute the slip ratio and the experimental longitudinal force. By estimating the vertical load, we extract the experimental friction coefficient to generate the curve.
Pure lateral slip test (skid pad)
This test isolates the tire's cornering stiffness and lateral force generation.
Procedure: The driver enters a predefined "figure-8" skid pad course. They perform two constant-radius clockwise laps, transition through the center, and two counter-clockwise laps, strictly minimizing braking and acceleration.
Recorded data: Lateral acceleration, steering angle, and vehicle slip angle (via S-Motion).
Computation: The data is used to calculate the lateral force and overlay it against the slip angle ($\alpha$) to fit the lateral Pacejka curve parameters.
Acceleration measurements can be heavily distorted by imperfect sensor installation. Specifically, we corrected for two main sources of error:
Offset from the Center of Gravity (COG): The Navion measures acceleration at its physical mounting point rather than the vehicle's true center of gravity.
Axis misalignment: Occurs when the Navion’s axes do not perfectly align with the vehicle reference frame, resulting in apparent acceleration components even when stationary.
To correct axis misalignment caused by imperfect sensor installation, the following equations were applied:
Where,
is the Navion measure of the acceleration component;
is the corresponding value when the vehicle is stationary;
is the angle between the Navion’s x-axis and the vehicle’s x-axis;
is the angle between the Navion’s y-axis and the vehicle’s y-axis.
To correct the error due to offset from the center of gravity, the following equations were applied:
Where,
is the time derivative of the vehicle’s pitch rate;
is the time derivative of the yaw rate;
a, b, and c represent the distances along the x-, y-, and z-axes, respectively, between the vehicle’s center of gravity and the Navion sensor.
Test results and simulation correlation
The sensor system used enabled the acquisition of high-quality data. The maneuvers analyzed and compared with their simulation counterparts include pure longitudinal tests, for which acceleration results are presented, as well as pure lateral tests.
As a first step, as previously explained, the acceleration values recorded by the Navion system were used to generate tire curves that replicate the tires' actual behavior. Figures 10 and 11 present the outputs from the T.R.I.C.K. tool, showing the force values calculated from the dynamic conditions recorded during on-track testing


Acceleration test
The acceleration maneuver consists of covering 75 meters in the shortest possible time. The following figures present the velocity profiles obtained from experimental testing and from simulations, using both the initial and the improved tire models. The improvement is clearly evident, with the enhanced model yielding a significantly more realistic simulation response. To support this observation, the maneuver completion times are also reported: the percentage error was reduced from 30.40% to 1.68%.


| Run | Elapsed Time (s) | Error (%) |
|---|---|---|
| Run | Elapsed Time (s) | Error (%) |
| Real | 4.77 | - |
| Simulated (initial .tir) | 6.22 | 30.40 |
| Simulated (final .tir) | 4.85 | 1.68 |
The longer elapsed time observed in the simulation can be attributed to the model's lack of traction control, whereas traction control was active during real-world testing. Incorporating traction control into the simulation could further improve its accuracy.
Pure lateral test
During the lateral test, several laps were conducted in which the driver was instructed to minimize braking and acceleration while cornering. The trajectory and velocity data acquired via GPS were used as inputs to the simulation. It was observed that, with the initial tire model, the simulated vehicle was unable to replicate the conditions recorded on track.


Conversely, the final optimized model accurately emulates real vehicle behavior, closely following the trajectory recorded during the real stint. A useful comparison for validating the results is the steering angle plot: the logged data and the simulated output show strong agreement.


Conclusion: a validated model for future vehicle development
Upgrading the tire model and validating the vehicle dynamics simulation were key to understanding the car’s limits and reliability, optimizing setup, and guiding future design decisions.
Our study confirmed the simulation's accuracy by comparing real and virtual data collected during acceleration and lateral maneuvers. Improvements to the tire model significantly enhanced realism, enabling more precise predictions of dynamic behavior.
Acknowledgments
We sincerely thank the Dewesoft Italia team for their support, with special appreciation to Riccardo Petrei and Davide Carniani for enabling the test campaign and providing technical assistance throughout installation and track testing.
We also thank Megaride Srl for its collaboration and access to the T.R.I.C.K and RIDElab tools, with special appreciation to Guido Napolitano Dell’Annunziata.
Finally, we acknowledge the UniNa Corse team for their commitment and contribution to this research.