




Optimizing Ethanol Vehicle Efficiency Through Thermal Testing
Fabio F. Caramia, Francesco Cuccia, and Andrea Lucarelli
Polytechnic University of Turin
October 23, 2026
How can engineers improve the efficiency of an ethanol-powered vehicle by optimizing engine temperatures and cooling configurations? Team H2politO from the Polytechnic University of Turin investigated this challenge using Dewesoft IOLITE data acquisition and temperature measurements. Through on-track testing, the team evaluated three powertrain cooling configurations and developed a validated thermal model to improve vehicle efficiency and racing strategy.
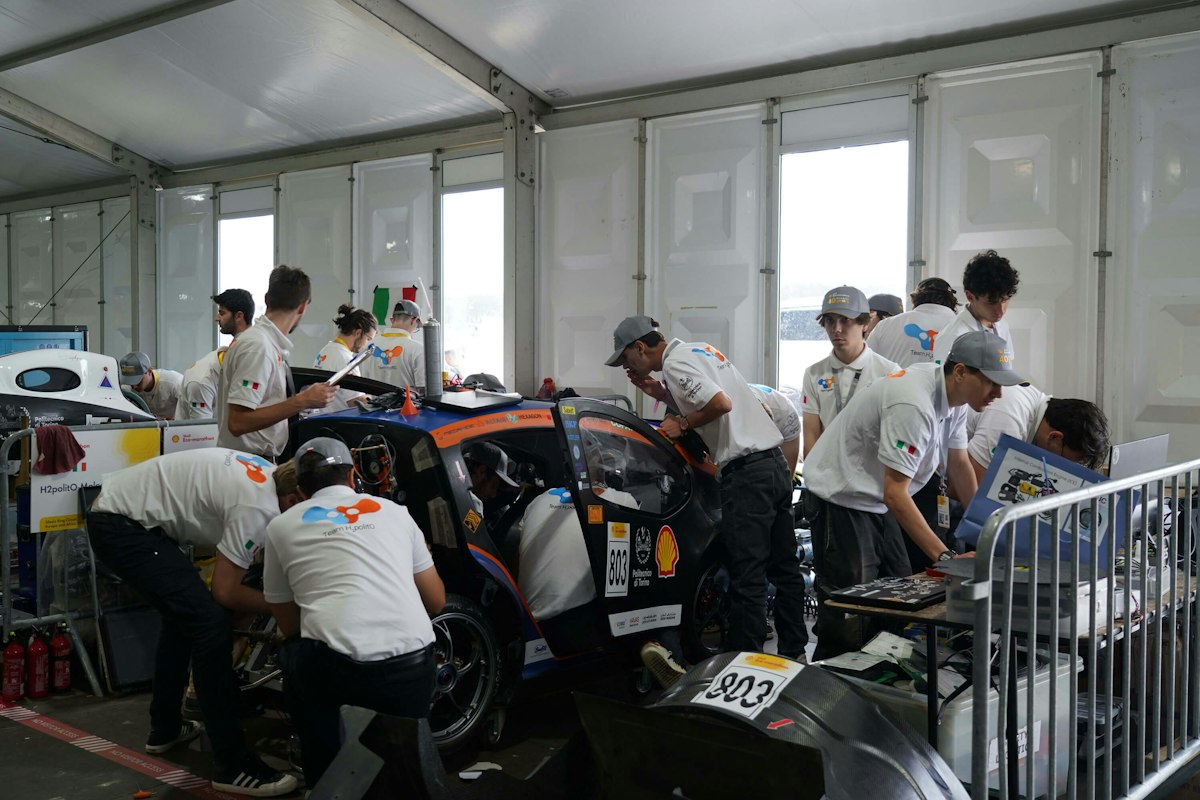
Team H2politO and the Shell Eco-Marathon
Team H2politO is a student team focused on alternative propulsion vehicles at Politecnico di Torino, the Polytechnic University of Turin. Each student member has a different profile and school experience. The interaction of the different engineering disciplines- Aerospace, Automotive, Chemistry, Electronics, Energetics, Informatics, Mechanics, and Mechatronics- contributes to its continuous improvement.
The team participates in the Shell Eco Marathon Europe-Africa, a fuel-consumption competition. During the competition, the aim is to complete a 16 km run in a maximum of 36 minutes, making 10 laps of the track, with the car stopping at the start/finish line each time to simulate urban behavior. While doing this, fuel consumption is measured, and the team with the least amount of fuel used wins.
The team has two vehicles participating in the two categories:
ICE Urban Concept (JUNO),
Hydrogen Fuel Cell Prototype (IDRAzephyrus).


Thermal efficiency testing of the JUNO ethanol vehicle
Our thermal efficiency testing involves the Urban Concept vehicle JUNO (see Table 1 and Figure 2). JUNO is a lightweight single-seater carbon monocoque vehicle, powered by a single-cylinder 50 cc bioethanol engine. It has full suspension, disc brakes, lights, and a wiper, like a normal car, and is designed for real-world use with maximum efficiency.
JUNO 1 - the Urban Concept Vehicle
| Specification | Description |
|---|---|
| Propulsion | 50 cc internal combustion engine |
| Tank | 250mL fuel tank |
| Chassis | Carbon fiber monocoque |
| Braking system | Hydraulic braking system |
| Transmission | Planetary gear and manual clutch |
| Steering system | Front steering wheels, pinion, and rack |
| Empty Mass | 129 kg |
| Length | 2880 mm |
| Width | 1220 mm |
| Height | 1170 mm |
| Ground height | 100 mm |


To achieve the best race results, it is equipped with in-house telemetry, enabling the team to develop a vehicle dynamics model and study race strategies to the fullest extent.
The powertrain plays a key role in the results. Due to the 10 stops (mandatory for the urban concept at the competition), JUNO is fitted with a centrifugal clutch and a one-speed transmission to ensure the most consistent start each time.
Both the transmission and the engine's thermal behavior play a key role in the car's efficiency.
Our team’s Vehicle Dynamics & Strategy Division simulates the car's behavior on each lap to determine the most efficient driving strategy and communicate with the driver during the race for any strategy changes. The Division leverages a data-driven methodology to construct a comprehensive car model. This model facilitates the acquisition of crucial information, enabling further refinement and optimization of various vehicle components.
Understanding the impact of powertrain temperature on efficiency
To create a racing strategy that makes the vehicle run as efficiently as possible, both in terms of its components and its interaction with the surroundings, it is necessary to have a model that considers both the energy aspects of the various components and the vehicle's dynamic behavior.
One of the main components stressed during the race is the powertrain. Due to heat generated by both friction and the engine, the behavior of the components will change, and so will both efficiency and strategy.
In our case, the main limitation is the lack of adequate tools to acquire vehicle data, such as temperatures at specific points in the vehicle’s powertrain. Until now, for the team's theoretical models, some component parameters, such as the thermal capacities and temperatures of the combustion engine and transmission system, were not included in the simulation model.
Our goal was to determine the best engine configuration for the race by achieving optimal temperatures for both the engine and transmission to maximize efficiency.
Dewesoft data acquisition for vehicle thermal testing
The project involved collaboration among several actors, each with a key role in the measurement and data acquisition process. Our team, composed of students from the Polytechnic University of Turin, needed to obtain precise, reliable measurements to analyze in detail the behavior of our urban concept, JUNO.
To support us in this goal, we collaborated with Dewesoft, a company specializing in data acquisition systems.
Dewesoft provided us with a high-performance analog-digital acquisition system, which was essential for collecting signals from the various sensors installed on the vehicle. In addition, it provided us with the IOLITE and thermocouples, essential tools for accurately reconstructing the vehicle's thermal behavior under operating conditions.
Thanks to this solution, we were able to obtain valuable information from otherwise inaccessible areas in the engine head, the transmission, and the engine bay of the rear part of the car, all captured in a single solution.
Temperature measurement setup using Dewesoft IOLITE
During the track test, Dewesoft's advanced instrumentation was used to collect a wide range of data. Specifically, the IOLITE system was used to collect data from three different thermocouples mounted on our Urban Concept JUNO.
Therefore, the tests were designed and conducted to build a structured, comprehensive database. This database aims to be a valuable resource for analyses, supporting ongoing development and comparison with future tests.
The setups were carried out on JUNO in preparation for track testing. In particular, DEWESoft Italia provided the following instrumentation:
An IOLITE modular industrial data acquisition (DAQ) system, and
3 Class 1 K-type thermocouples. According to IEC 60584-1 standards, the measurement system provides an expanded uncertainty of 1.5°C within the operating temperature range.
Various vehicle setups were considered to identify the best one and understand the impact of temperature across different race conditions. For each setup, 4 laps were done to acquire data.
Three different configurations of powertrain were used:
Fan mounted to the combustion engine.
Fan not mounted to the combustion engine.
Fan not mounted; external air intake for the combustion engine.
For the thermocouples in particular:
“T_trans” temperature of the thermocouple placed on the transmission casing
“T_bay” temperature of the thermocouple placed on the engine bay
“T_eng” temperature of the thermocouple placed on the engine head
Thanks to the IOLITE, it was possible to connect all three thermocouples directly to it using simple K connectors (see Figure 3). For ease of use, a power bank was used to supply power to the instrument.
Then all the thermocouples were routed through the rear carbon-fiber firewall to the engine bay, where they were secured with high-temperature-resistant tape (see Figure 4).
A simple test to ensure that everything worked was done (Figure 5). To record data, a PC must be connected to the system via Ethernet at all times, so it will also be inside the car during testing.
After everything was set up, it was decided to place the instrumentation on the rear left behind the seat to avoid interfering with both the driver's movements while the car was running and the measurements (see Figure 6).
Everything was held in place with both Velcro and tape to prevent vibrations or lateral forces from causing the cable to disconnect and lose data.


On-track temperature measurements and results
Before each track session, data logging was manually initiated via the onboard computer, which was connected directly to the acquisition system. Concurrently, a rigorous daily track log was maintained to document environmental conditions, driver feedback, and real-time track events, ensuring full traceability of the telemetry data. The gathered datasets were subsequently processed and analyzed using DewesoftX data acquisition and signal-processing software. With technical support and expertise from Dewesoft engineers, we maximized the accuracy of signal analysis.
To ensure consistency, the combustion engine was started and brought to operating temperature before initiating each 4-lap test run. Consequently, the initial thermal state of the powertrain assembly varies across setups, playing a critical role in transient warm-up behavior and influencing the time required for components to reach steady-state conditions.
Test 1: engine temperature with active cooling
After completing approximately half of the scheduled laps, both the combustion engine and transmission temperatures began to asymptotically approach a peak, stabilizing around a consistent thermal plateau. This behavior is primarily governed by the thermal capacity of the structural components during the transient warm-up phase and by the progressive approach to thermodynamic equilibrium.
As the run progressed, the cumulative thermal energy generated by engine combustion and mechanical friction within the centrifugal clutch balanced out with the heat dissipation rate to the surrounding environment. Consequently, the net heat input could no longer elevate the bulk temperatures of the powertrain assembly (see Figure 7 and Table 2).
This stabilization indicates that a reliable and steady-state thermal baseline was successfully established for the vehicle under these specific operating conditions. This baseline serves as a fundamental reference point, essential for isolating and quantifying the thermodynamic impacts of the alternative powertrain configurations evaluated in the subsequent setups.


| Vehicle Component | Initial Temp. (°C) | Average Temp. (°C | Final Temp. (°C) |
|---|---|---|---|
| Combustion Engine | 49.2 | 99.8 | 122.4 |
| Transmission | 38.1 | 50.7 | 57.36 |
| Engine Bay | 28.5 | 35.9 | 40.6 |
Test 2: engine temperature without the cooling fan
For this second configuration, removing the cooling fan isolates the engine bay's internal volume, significantly reducing forced convection and preventing active air circulation around the powertrain components. These effects are visible in the data.
Despite operating without active cooling, critical thermal thresholds were never exceeded during the run. Maintaining higher running temperatures proves highly beneficial for overall powertrain efficiency, yielding two distinct advantages. First, from a mechanical efficiency perspective, because the fan is directly keyed to the crankshaft, eliminating it removes a significant parasitic rotating mass. This reduction in rotational inertia directly minimizes parasitic losses and enhances the engine's transient response. Second, the higher thermal regime lowers lubricant viscosity, thereby reducing mechanical shear friction.
Under these conditions, both the engine bay and transmission temperatures exhibit a highly linear heating curve. Furthermore, the cylinder head temperature approaches its thermal equilibrium significantly earlier in the session than in the baseline setup. The accelerated warm-up phase minimizes transient thermal losses to the structural walls, thereby maximizing the thermodynamic expansion work and further increasing the engine's thermal efficiency (see Figure 8 and Table 3).
| Vehicle Component | Initial Temp. (°C) | Average Temp. (°C) | Final Temp. (°C) |
|---|---|---|---|
| Combustion Engine | 81.9 | 122.9 | 149.3 |
| Transmission | 42.1 | 51.3 | 63.9 |
| Engine Bay | 26.8 | 31.6 | 38.9 |
Test 3: engine temperature without the fan and with external air intake
In the third configuration, the introduction of a dedicated external ducting system allowed the engine to draw fresh, ambient air directly from outside the vehicle body.
By eliminating the aggressive forced convection and heat extraction provided by the mechanical fan, the cylinder head reaches its asymptotic steady-state operating temperature significantly earlier in the session. The accelerated transient warm-up phase minimizes the duration of sub-optimal thermal operation.
Simultaneously, this routing supplies the combustion chamber with colder, denser intake air, maximizing the fresh-air mass flow rate, optimizing volumetric efficiency, and preventing the density losses typical in hot-running engine environments. Although a technical constraint prematurely limited this test session to three laps, the telemetry data clearly demonstrates a much steeper thermal transient, with all powertrain components approaching their targeted high-efficiency thermal windows in a significantly compressed timeframe (see Figure 9 and Table 4).


| Vehicle Component | Initial Temp. (°C) | Average Temp. (°C) | Final Temp. (°C) |
|---|---|---|---|
| Combustion Engine | 56.4 | 115.6 | 145.41 |
| Transmission | 48.2 | 53.2 | 59.4 |
| Engine Bay | 33.56 | 36.4 | 40.6 |
Developing and validating a powertrain thermal model in Siemens Amesim
The high-fidelity empirical datasets gathered on-track via Dewesoft systems proved instrumental in modeling the complex transient thermal behavior of the powertrain components, significantly increasing the predictive accuracy of the comprehensive vehicle simulation.
This correlation was achieved by developing a thermal model of Juno in Amesim, Siemens' mechatronic systems simulation software. The model simulates heat transfer mechanisms using an electro-thermal analogy, in which thermal nodes are interconnected and directly coupled to the internal combustion engine block.
The model itself focuses on three primary interacting blocks:
The thermal mass and capacitive energy storage of the engine bay.
The thermal mass and capacitive energy storage of the engine.
The thermal mass and capacitive energy storage of the transmission.
Each of these subsystems is characterized by its own specific thermal resistance and thermal capacitance (Figure 10), which dictate the transient thermal response, conduction paths, and heat rejection rates relative to the net heat generated by combustion and mechanical friction.
Furthermore, the model allows integration of experimental initial temperatures for each node, thereby replicating the exact thermal state of the vehicle at the start of each track session. By embedding these physical parameters into the Amesim framework, the simulation captures the powertrain's intricate real-world thermal dynamics with high fidelity.


To streamline and optimize the model correlation process, the empirical telemetry datasets extracted from a specific Dewesoft test session were synchronized and overlaid onto a unified graphical plot, mirroring the exact layout generated by the numerical model (see Figure 11).
Visualizing the synchronized channels simultaneously allowed for an immediate, qualitative comparative analysis of the transient curves. By directly comparing the experimental dataset from the physical thermocouples against the simulated thermal ones from the Amesim model, it was possible to intuitively evaluate the characteristic shapes, slopes, and behavioral trends of the model.


Although the inherent simplifications of a 1D thermal simulation preclude an exact, point-by-point replication of the physical environment, the model demonstrates exceptional fidelity in tracking transient behavior. The simulated peaks and valleys closely mirror the experimental data, with a maximum deviation of less than 3% across the entire driving cycle (see Figure 12). This tight correlation confirms that the model accurately captures the powertrain's thermal inertia and energy dissipation, making it a reliable tool for optimizing predictive race strategy.
Improving powertrain efficiency through thermal testing and modeling
The experimental track tests yielded highly valuable data, validating the approach of simulating complete race runs to accurately replicate real-world operating conditions. Among the configurations tested, Setup 3 proved to be the optimal solution for maximizing overall powertrain efficiency.
From a thermodynamic and mechanical perspective, operating at higher engine temperatures is highly beneficial for efficiency because it significantly reduces mechanical friction by ensuring the engine oil operates within its optimal lower-viscosity window, while simultaneously minimizing parasitic heat rejection through the cylinder head walls, thereby maximizing useful expansion work during combustion. At the same time, the dedicated external intake ensures a continuous supply of cold, dense intake air, which optimizes volumetric efficiency by maximizing the fresh air mass flow rate into the cylinder and preventing the performance drops typically associated with drawing hot air from the engine bay.
Also, eliminating the cooling fan that introduces substantial parasitic losses, including rotational inertia on the crankshaft and aerodynamic drag within the engine bay, is optimal, so removing it directly improves the engine’s transient response during acceleration phases. Despite the elevated running temperatures, we never reach a limit, maintaining a stable engine bay environment and completely avoiding the dangerous thermal soak observed in Setup 2.
Furthermore, aligning the experimental telemetry curves with the numerical profiles
significantly enhances the model's predictive capability, enabling a comprehensive integration of real-world thermal efficiency within the vehicle's strategy framework. In a race scenario, this validated digital twin can be deployed dynamically by using ambient temperature as the initial condition for the thermal nodes at the starting line, thereby making the race strategy even more precise.

