Measuring Aircraft Banner Drag with Wind Tunnel Testing
Brian Kleva and Viktor Primožič Gogala
DBF Edvard Rusjan Team, University of Ljubljana
November 19, 2026
To validate aircraft banner drag simulations, the Edvard Rusjan Team from the University of Ljubljana conducted wind tunnel tests using Dewesoft data acquisition technology. By measuring drag force and dynamic pressure across seven banner materials, the team refined its simulation model and selected an optimal material for the 2026 AIAA Design-Build-Fly competition, where it secured first place.
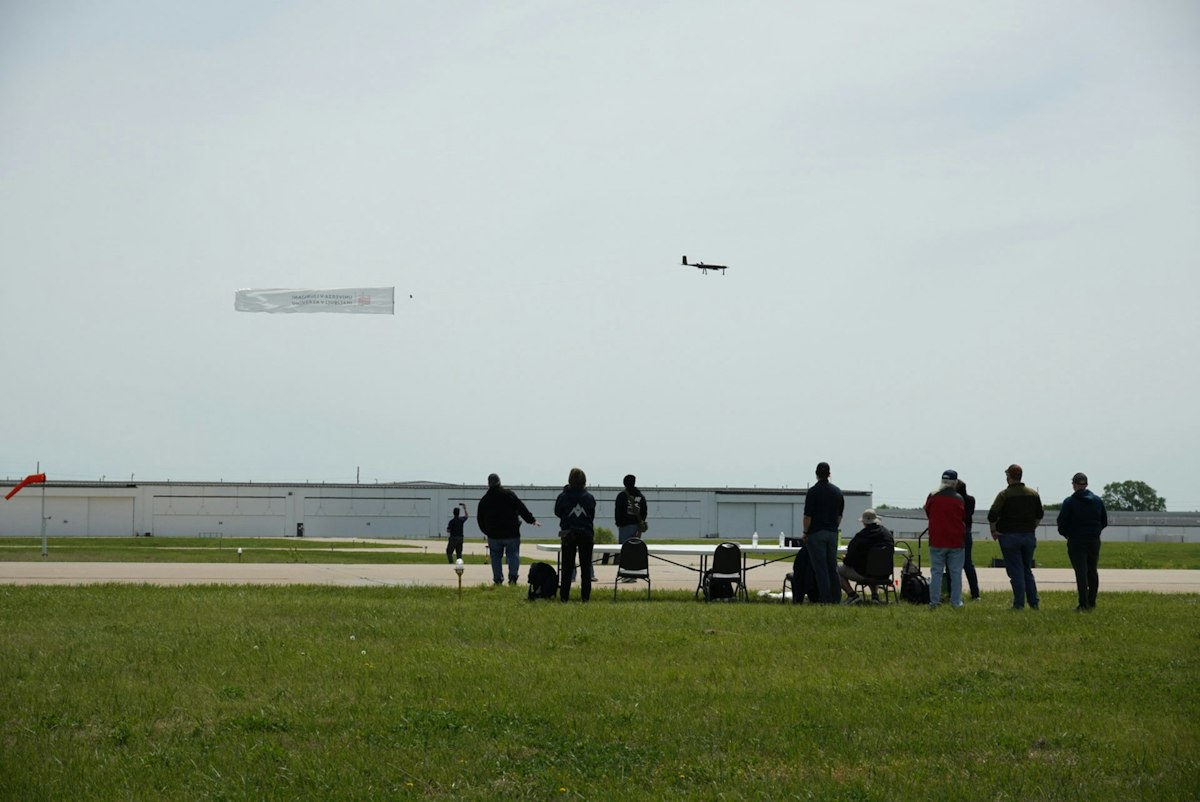
Named after Slovenian aviation pioneer Edvard Rusjan, the Edvard Rusjan Team brings together students from different faculties at the University of Ljubljana. Each year, the team competes against universities worldwide in the Design-Build-Fly (DBF) competition in the United States, designing, building, and flying radio-controlled aircraft. In 2026, the competition's 30th anniversary, the team achieved first place.
Each year, the competition introduces new missions, requiring teams to redesign their aircraft from the ground up. The Edvard Rusjan Team uses simulations to evaluate a wide range of configurations and identify promising designs early in development. These designs are then refined through testing, data collection, and analysis. Dewesoft measurement equipment and software help the team validate simulation results with real-world data and improve the final aircraft design.


The AIAA design-build-fly competition
The Design, Build, Fly (DBF) competition is an annual international student engineering competition organized by the American Institute of Aeronautics and Astronautics (AIAA). It challenges university teams to design, build, and fly a remote-controlled aircraft according to a specific set of rules and mission requirements that change every year, providing an opportunity for university students to apply real-world aircraft design experience and validate their analytical studies.
The competition consists of two main parts: the technical report and the fly-off. The report is submitted before the competition and documents the team organization, design process, aircraft configuration, simulations, testing methods, and technical drawings. The fly-off then serves as the practical demonstration of the aircraft’s performance. Both the report and mission performance contribute to the final score. Thus, successful teams must not only build an aircraft that flies reliably, but also justify their design choices through analysis, simulation, and testing. This makes accurate performance prediction an important part of the development process.
The 2026 aircraft design challenge: banner towing
For the 2026 competition, the objective was to design, build, and test a banner-towing bush plane. The aircraft had to complete four missions, each testing a different aspect of the design.
Mission 1 served as a basic flight demonstration, proving that the aircraft could take off, complete three flight laps, and land safely. Mission 2 was a charter-style transport mission in which the aircraft carried passengers and cargo, represented by rubber ducks and hockey pucks. In this mission, the goal was to maximize the useful payload transported while maintaining reliable flight performance.
The ground mission was closely linked to Mission 2 but focused on loading efficiency rather than flight performance. Teams had to load all passengers and cargo onto the aircraft, unload them, and finally install the stowed banner, all in the shortest possible time.
Mission 3 introduced the main challenge of the 2026 competition: banner towing. The aircraft had to deploy, tow, and release a rectangular banner with a maximum aspect ratio of 5:1 during flight. The score depended on the number of completed laps and the banner's length, making it necessary to tow the largest possible banner while maintaining sufficient speed, stability, and controllability.
Unlike passengers and cargo, which were carried inside the aircraft, the banner created a large external aerodynamic load. This made Mission 3 especially demanding, as the banner drag directly affected the required thrust, flight speed, energy consumption, and achievable mission score. Understanding this drag became an important part of the design process and called for dedicated real-world testing.


Why accurate banner drag measurements matter
The Edvard Rusjan Team has a long-standing history of success in the DBF competition, frequently placing among the top teams. This success is largely attributed to the team’s ability to develop a highly optimized aircraft using custom simulation tools. These simulations evaluate a wide range of potential aircraft configurations and compare them based on aerodynamic performance, propulsion efficiency, mission performance metrics, and overall competition score.
The team understands that the accuracy of their simulations depends heavily on the quality of input data. For conventional aircraft components, such as wings, motors, propellers, and batteries, the team can rely on the combination of manufacturer data, known aerodynamic coefficients, previous testing, and accumulated experience from past competition years. These inputs allow the simulation model to estimate aircraft performance with reasonable reliability.
The 2026 banner-towing mission introduced a different type of aerodynamic challenge. Unlike passengers and cargo, which were carried inside the aircraft, the banner created an external drag force that depended strongly on its material, size, and airspeed. Since the banner was flexible and interacted with the airflow in ways that were difficult to predict analytically, relying solely on simplified assumptions would not provide a sufficiently reliable basis for optimizing the aircraft.
This made banner drag one of the key uncertainties in the simulation model. To reduce this uncertainty, the team needed to determine not only how much drag the banner produced but also how that drag varied across different materials and flight speeds. The real-world testing campaign was therefore designed around two main goals.
The first goal was to improve the banner drag model used in the simulation. To accurately compare different aircraft configurations, the simulation needed a realistic estimate of the banner’s drag coefficient. The second goal was to select the most suitable banner material. Different materials can produce different drag levels even when tested at the same size and airspeed, making material choice an important design parameter.
For this reason, the team tested several banner materials across a range of airspeeds. Measuring the drag force under controlled conditions made it possible to estimate a representative drag coefficient for each material. This data could then serve as a more reliable simulation input than a purely assumed value, enabling the team to model banner performance with greater confidence during the design process.
Wind tunnel test setup for banner drag measurement
The team found the opportunity to conduct their testing at the local wind tunnel Aerodium Logatec, which is used for skydiving. Being big enough for the banner and having a wide airspeed range (from 25 to 230 km/h), it was the perfect testing environment.


The test rig was constructed from a 3m 45x90 aluminum profile that was inserted into the middle of the wind tunnel. To mitigate airflow disturbance, teardrop-shaped covers were 3D-printed along the entire length of the profile. At the end, it was equipped with an S-beam load cell and a pitot tube with a precision manometer, both connected to a DEWE-43A DAQ system.
The load cell was calibrated beforehand by engineers from Dewesoft Inspiretech, using calibration weights and a measured gravitational acceleration at their workshop.
The manometer was calibrated at the Laboratory for Measurements in Process Engineering, Faculty of Mechanical Engineering, UL.


Data acquisition hardware and software
Windows PC
DewesoftX data acquisition software version 2025.2
Dewesoft DEWE-43A 8-channel USB data acquisition system
Precision manometer ManoAir100 with a 20-inch pitot tube
Load Cell DYLY-107 20 kg
Portable power station


Wind tunnel testing and drag coefficient calculation
The team conducted wind tunnel tests to measure the aerodynamic drag of seven different banner materials. Each banner was attached to an S-beam load cell positioned in the center of the wind tunnel. A standard banner size of 3 × 0.6 m was selected to comply with the competition's maximum aspect ratio of 5:1 while balancing the wind tunnel's limitations and material costs.
For each material, the team measured drag force and dynamic pressure at six airspeeds ranging from 50 to 120 km/h. Measurements were recorded over 30-second intervals at constant airspeed and averaged to reduce noise caused by test rig oscillations and banner flutter.
The measured data were used to calculate the aerodynamic drag coefficient (Cd) for each material, providing reliable inputs for aircraft performance simulations.
To streamline the measurement process, the team used DewesoftX Sequencer to automate data acquisition, completing more than 40 recordings. The recorded data were then exported and analyzed using a custom Python script.


Configuring DewesoftX for drag force measurement


Measurement channels and automated data acquisition
Banner drag measurement results and material comparison


The wind tunnel tests revealed clear differences between the seven banner materials. Across the measured airspeed range, drag coefficients remained relatively stable, decreasing slightly as airspeed increased. These results provided reliable inputs for the team's aircraft performance simulations.
Lightweight nylon (labeled nylon_3 in the graphs) produced the lowest drag coefficient, with values below the team's preliminary estimate of 0.02. It also showed the most consistent drag force measurements across repeated tests, with the lowest standard deviation. In contrast, materials such as Peelply generated higher drag and greater measurement variability, making them less suitable for the final banner design.
Based on these findings, the team selected Nylon sample 3 as the final banner material. The measured drag coefficient differed from the original estimate by approximately 10–15%, allowing the team to refine its simulation model using experimental data.
The results also confirmed that the selected aircraft configuration had sufficient energy margin for banner towing and landing. This allowed the team to use slightly longer banners than initially anticipated, improving its estimated Mission 3 score.


Conclusion: validating simulations with measured drag data
Dewesoft data acquisition equipment and software enabled the Edvard Rusjan Team to accurately measure banner drag, compare different materials, and validate its aircraft simulation model.
Real-time monitoring and automated data acquisition helped the team identify measurement irregularities, collect consistent data, and focus on analyzing the results. The measurements provided a reliable basis for selecting the banner material and refining the aircraft's predicted performance.
By combining simulation with experimental testing, the team made more informed design decisions and optimized its aircraft for the 2026 AIAA Design-Build-Fly competition. These efforts contributed to the team's first-place finish with its aircraft, Brvinc.

The experiment would also not be possible without the help of Aerodium Logatec, Dewesoft Inspiretech, Laboratory for Hydraulic Machines (FS UL), Laboratory for Measurements in Process Engineering (FS UL), Peskovnik (FS UL), Tuli, OneDrone, Plastika Trček, and a joint effort of over 15 team members.