


Measuring and Analyzing Electric Motor Vibration
Giacomo Boschin (Department of Engineering)
University of Trieste
October 6, 2023
Many branches of engineering use electric motors. From industrial plants and machinery to automotive applications. Like any other rotating machinery, vibration and noise are issues of concern.
The advent and proliferation of electric propulsion highlight noise problems that engineers often overlooked in internal combustion engines. The gasoline engine noise drowns out these ‘new’ noises. Vibration investigation and determination of frequencies are needed to achieve optimum electric motor efficiency.
In modern engineering, rotating machinery is commonly used to generate motion. Due to its nature, the continuous operation of rotating machinery produces vibrations. Vibrational phenomena affect machine performance and can lead to machine failure.
Knowing what generates the vibration and how to reduce it can make the difference between introducing a successful or failed product.
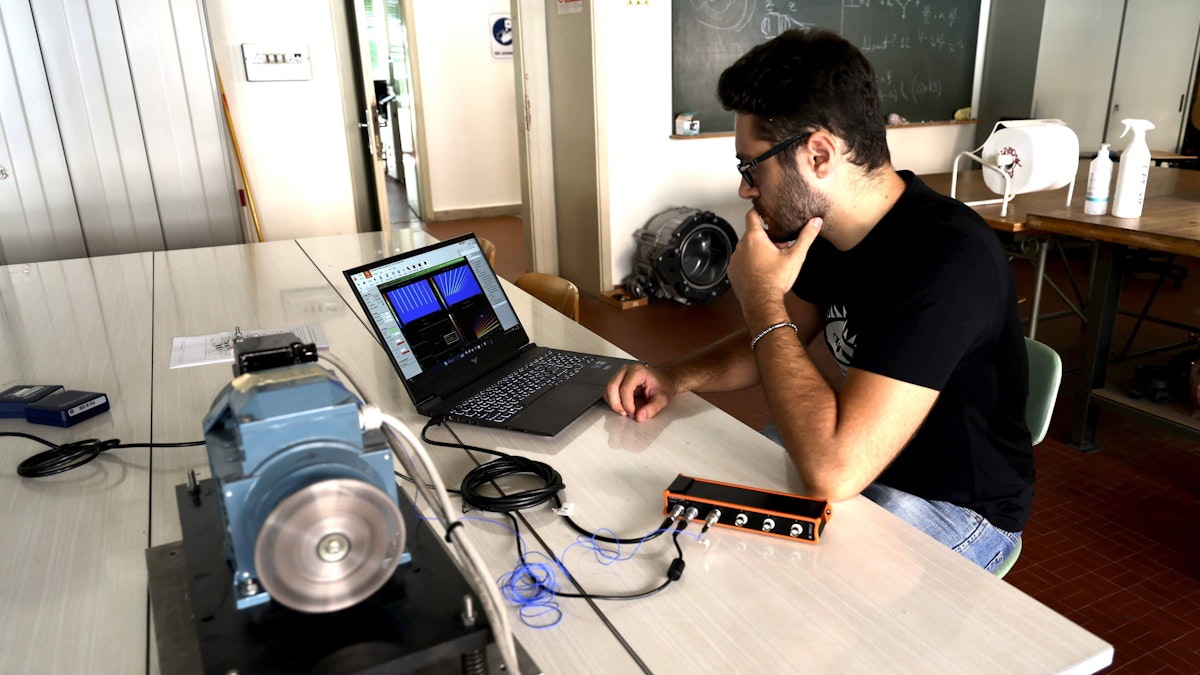
At the University of Trieste, my team and I studied and analyzed vibration factors in electric motors. Employing the Dewesoft data acquisition system, we aimed to enhance our understanding of the motor/plate system dynamics.
Even under acceptable conditions, any machinery produces vibrations. Many of these vibrations are directly related to periodic events that occur during the operation of the machine, such as:
Rotation of a motor shaft,
The meshing of gear teeth, and
Rotating electric fields, etc.
The frequency at which these events occur can indicate the source of the vibrations. Frequency analysis is the basis of many powerful diagnostic techniques.
That said, the objectives of this study are essentially twofold:
Investigate an electric motor mounted on a plastic plate, connected to the ground via springs. Observe the engine’s vibration behavior as its rotational speed increases and crosses the resonant frequencies.
Determine which frequencies are the most critical for the system and identify the possible sources of vibration amplification.
Order tracking analysis
Order tracking analysis is a perfect tool to determine the operating condition of rotating or reciprocating machinery, especially when machines run at varying speeds.

When analyzing rotating machinery, two properties are of particular interest, two measurable quantities:
Amplitude or intensity: How far the object moves, and
Frequency: How fast the object moves.
The terms used to describe this movement are frequency, amplitude, and acceleration. As always in vibration analysis, the structural resonances (modes) because they amplify vibrations.
On rotating machines, vibrations caused directly or indirectly by the rotation itself are also of interest. They can become large without any resonance amplification. Mechanical imbalances, axle deformation or misalignment, defects in bearing races, or defect teeth on gears can cause such vibrations.
Each of these vibration sources produces vibration at a particular factor times the rotational speed of the machine. Rotating machinery can generate rotational speed-dependent vibration at natural structure resonance and natural frequencies. These often cause high vibration levels and vibrational problems - even a disaster could strike.
A factor times the rotational speed is called an order. The rotation speed is referred to as order 1. Two times rotation speed is order 2, etc. Orders don’t need to be in integer numbers. You can have orders of 2.5 or 3.938, etc.

Engineers often use two-dimensional diagrams called order tracks when interpreting how different rotational-speed-dependent components contribute to vibration or sound levels. They calculate these diagrams from the RPM map and extract information about the RMS (Root Mean Square) value of an order component versus the RPM.
Vibration measurement setup
The equipment mounting
Before it was possible to acquire any data, I had to build the physical system. The first element was a three-phase electric motor with a rated speed of 1410 RPM. It was powered by 220V (50 Hz) and connected in a delta configuration.
Using screws and nuts, I mounted the motor on a plastic-plate base. Below the motor base, near the four corners, four springs were placed, also secured with screws and nuts. Underneath each spring, I positioned an anti-slip material block to increase friction on the support surface. Figure 2 shows the final system on which I made the measurements.


Connecting the motor to an inverter device allowed me to control the rotor’s rotation speed and manage acceleration and deceleration timings.
Vibration data acquisition system
The vibrations produced by the rotation of the electric motor rotor, especially when far from resonance frequencies, have a tiny amplitude. They can be difficult to detect visually. I had vibration amplitudes on the order of tenths of a millimetre under normal conditions and on the order of a millimetre near resonance frequencies.
Signals emitted from physical systems are analog, while computers and calculators operate with discrete time and amplitude signals. For this reason, measurement and monitoring require transducers and signal amplifiers.
Transducers are devices that transform a physical phenomenon into an analog signal. An ADC (Analog-to-digital converter) inside an amplifier then converts this analog signal into digital data for further processing inside the computer SW.
Among the various transducers used, it is common to encounter accelerometers, devices that convert accelerations into an electrical signal. I applied these for this case; in particular, I used IEPE (Integrated Electronics Piezo-Electric) accelerometers.
The output of an IEPE sensor is a low-impedance voltage signal, whereas piezoelectric sensors that don’t have built-in electronics can only produce a charge output. The amplifier employed in an IEPE sensor can be a voltage amplifier or a charge amplifier.


I also used a KRYPTON rugged EtherCAT data acquisition (DAQ) system supplied by Dewesoft. This fundamental device helped me in many important aspects:
Signal amplifier: The output signal from the transducers is usually weak, and I performed an additional amplification before converting it into a digital format.
Signal conditioning: Then, performing various operations such as filtering, additional amplification, and time integration, the signal conditioner processes the amplified signal.
Recorder: For me, the recorder was non-essential but handy. The instrument allowed me to store experimental data.
Digital/Analog converter: It is a nonessential but commonly included instrument because it allows signal processing with a PC. The signal from the transducer is a continuous “analog” signal whose waveform corresponds to the measured quantity. The D/A converter detects the instantaneous value of the signal at regular time intervals, transforming it into a discrete set of numbers, a digital signal. In this way, the output consists of numbers that can be managed and processed by a PC.
When analyzing rotating machinery, a rotation speed transducer, a tachometer, is used to measure the RPM. Such a transducer is usually either optical or inductive.
I used the optical tachometer sensor ICP Laser Tachometer by The Modal Shop. Being an IEPE device, it has been powered directly by the Dewesoft KRYPTON without needing an external power supply.
I fixed this sensor onto an adjusted support, which allowed it to point at some reflective tape attached to the outer part of the motor’s rotor. The setup enabled the sensor to count the times the taped rotor passed the tachometer laser beam. I obtained the motor’s number of rotations this way.
All was done in DewesoftX software using Angle sensor math functionality, which converts pulse train into RPM speed.


Measurements and the results
Acceleration ramps
As a first step, I wanted to see how the system behaves when running up with different acceleration ramps. I analyzed the system's response in three acceleration ramps - see Figure 5:
5 seconds
10 seconds
20 seconds.


Reducing or increasing the excitation frequency alters the instant resonance occurs and the peaks that the oscillations reach near it. With less steep ramps, the system has more time to respond to the excitation and manifest the effects of resonance. Consequently, the peaks reached by the oscillations will be higher.
With higher velocity gradients, the system struggles to keep up with the imposed excitation. As the excitation varies much faster, the system will still respond to the excitation from a few moments ago. The peaks occur earlier compared to lower accelerations and with less intensity.
Since I was mainly interested in vertical oscillations, I placed the uniaxial IEPE accelerometer the closest possible to the system’s central vertical axis.
I connected the accelerometers to the Krypton data acquisition system. Next, I set up the software. I specified the measurement type, which in this case was IEPE, and the unit of measurement to m/s2. I chose the sampling frequency of 1 kHz.
I also had to set a scaling factor for calibration. The transducer manufacturer provides this value and lists it as sensitivity in the datasheets. Therefore, it is sufficient to report this value in the sensitivity field. Highlighting the mentioned fields in the software, Figure 6 shows the interface for setting up the accelerometer.


With the accelerometer channel set up, I could acquire the necessary data for each of the three speed ramps. Figure 7 shows the system behavior when accelerating from 0 RPM to 1500 RPM in 5 seconds.


Information on the oscillating motor’s vertical position is the most useful and easiest to interpret. To obtain it, I processed a double time integration on the acceleration. Figure 8 shows how I set up a double-time integration and the results it produces.


The same was done for both 10-second and 20-second ramps, as shown in Figure 9.


As clearly visible from the acquisition results, the vibrations experience amplifications at two distinct moments of acceleration. The displacement signal allowed me to see the effects of the two resonance frequencies much easier than the acceleration.
Having obtained the displacement signal, I passed from the time domain to the frequency domain. I did this passing by employing the Fast Fourier Transform (FFT). FFT is a mathematical method for transforming a function of time into function of frequency.
The FFT converts a signal into its spectral components, providing information about the signal’s frequencies. FFT helped me find the system’s resonant frequencies. Figure 11 displays the FFT for the three ramps at the peak displacement recorded for the first of the two resonant frequencies.


Table 1 lists the frequencies at which the motor significantly amplified vibrations. Technically, a third resonant frequency was present, manifested between the first and second frequencies for the ramps.
However, this third frequency enhanced horizontal oscillations and was not detected easily by the accelerometer. I decided not to include it. The horizontal oscillation, which I measured using a transducer parallel to the plate’s short side, were small compared to the ones detected.
The first frequency is a 'bounce' frequency. The second and third are 'tilt' frequencies along the two principal axes.
| Ramps | First resonant frequency Hz/RPM | Second resonant frequency Hz/RPM |
|---|---|---|
| 5 seconds | 8,789 / 527,34 | 19,531 / 1171,86 |
| 10 seconds | 8,789 / 527,34 | 19,043 / 1142,58 |
| 20 seconds | 8,789 / 527,34 | 19,043 / 1142,58 |
Order tracking analysis and waterfall plots
Following the analysis of vertical oscillations, we made an order-tracking analysis on our motor using the DewesoftX analysis software. This analysis should determine whether there was any rotor imbalance or other system malfunction and show which contributed noticeably to vibration amplification.
As previously mentioned, the problems encountered in a rotating machine are closely related to the orders in which these issues occur. 1x Order phenomena in rotating machine indicate a residual imbalance, always present in real motors. Phenomena of the 2x Order indicates misalignment between the driving and operating machine.
Since my model was quite simple and the motor disconnected from any load, I expected to find the first order as the strongest. Confirmation that internal imbalance is the primary cause of vibrations.


Although DewesoftX software offers a variety of features, a simple measurement like this can be done in a very short time. As a first step, I need to set up the sensor that reads the rotor speed. I used a tachometric sensor as seen in Figure 13.


Then, I simply needed to use the DewesoftX Order Tracking (OT) module from the “Setup” section of the software. I set the parameters for order analysis, as shown in Figure 14 - highlighting the fields of our interest.

I measured during a two-minute coast-down and started analyzing the first 16 orders. I included only the first eight orders in the results, as they represented the most significant outcomes. Figure 15 shows the results obtained by the order analysis.


The obtained graphs in Figure 15 confirmed my expectations of the 1x order having the highest intensity compared to all the others. It was a real-life system, and the other Orders exhibited looseness, clearance, and misalignment indicated by the relatively high intensity of the 2x and 3x Orders.
Conclusions
The basic idea behind this study is to answer simple questions like:
What is causing the motor/plate system’s vibrations?
What could happen to the system when the motor runs up to maximum speed?
Analysis of this simple system not only allowed me to determine the main causes leading to vibration amplification in a rotating machine. I also observed the effects that occur when the motor goes through resonant frequencies.
Vibrations reaching high levels at resonant frequencies can harm the system and even be destructive. Knowing these resonance frequencies is fundamental to avoid operating near these conditions but also allows designers to improve the original design through changes and modifications.
Dewesoft data acquisition systems have proven to be perfect for this simple case. The flexibility of the acquisition platform allowed me to record multiple points at the same time. By enabling measurements in more directions, the platform allows even more complex and advanced analyses and reduces the time spent in the laboratory.
References
Noise and Vibration Analysis; Signal Analysis and Experimental Procedures – A. Brandt – Wiley, 2011.
Vibration-Based Condition Monitoring: Industrial, Aerospace and Automotive Applications – R. B. Randall – Wiley, 2010.