


Electro-Thermal Powertrain Model Validation of a Formula SAE Race Car
Francesco Giuseppe Quilici, Salvatore Mastrangelo, Matteo Raffaelli, and Leonardo Bove
E-Team Squadra Corse, University of Pisa
April 16, 2026
Accurate prediction of electrical and thermal behavior is critical for maximizing the performance and reliability of electric Formula SAE race cars. This case study presents the measurement-based validation of battery electrical and motor thermal models developed for the ET-17 electric prototype by E-Team Squadra Corse at the University of Pisa. Using high-bandwidth, synchronized measurements acquired with Dewesoft data acquisition systems during endurance-style testing, the team validated reduced-order models suitable for real-time predictive power and thermal management.
Accurate prediction of the electrical and thermal behavior of a Formula SAE electric powertrain is essential to maximize vehicle performance, properly tune control system parameters, and optimize cooling strategies. We performed a measurement-based validation of both the electrical battery model and the motor thermal model developed by the E-Team Squadra Corse for the ET-17 prototype.
High-fidelity, synchronized measurements of key electrical quantities were performed using Dewesoft data acquisition systems, enabling detailed monitoring of the powertrain under representative dynamic load conditions. We used the acquired data to validate a lumped electrical model of the energy storage system and a reduced-order thermal model of the electric motor, with parameters identified directly from experimental data. The results demonstrate that the validated battery model can predict the pack voltage response with a mean error below 2% across dynamic operating profiles.
Similarly, the motor thermal model accurately reproduces the measured temperature evolution, achieving a maximum absolute error below 5 °C. Due to their reduced computational complexity, the validated models are suitable for on-board implementation within a real-time power management control unit, enabling predictive strategies as a potential application of the presented work. These outcomes confirm that high-accuracy measurement systems are a key enabler for reliable model validation and predictive simulations, supporting data-driven design decisions and control strategies in electric racing powertrains.
Background and stakeholders
E-Team Squadra Corse is the Formula SAE team at the University of Pisa, founded in 2007 and focused on the design, development, and validation of high-performance electric race cars through applied engineering, experimental testing, and data-driven analysis.
Over recent years, the team has progressively transitioned toward a fully electric powertrain architectuertrain complexity increased, accurate experimental characterization became a critical requirement to support model-based design, control parameter tuning, and performance optimization. Reliare, culminating in the ET-17 prototype, a rear-wheel-drive electric racecar vehicle. As the powble validation of electrical and thermal models requires synchronized, high-bandwidth measurements under representative operating conditions, which are not achievable with standard onboard logging solutions alone.
To address these challenges, E-Team Squadra Corse established a long-term collaboration with Dewesoft, leveraging advanced data acquisition systems to support experimental validation activities across multiple subsystems of the vehicle, which has led to a common path now taken over time:
Season 2021-2022. Suspension stress measurements and vehicle dynamics validation: “Suspension Testing on Formula SAE Racecar”.
Season 2023–2024. Electrical power management, HV current and voltage measurement, and debugging the first electric prototype (EV-A): “Testing Powertrain on an Electric Formula SAE Car”.
Season 2024–2025. Thermal mapping of the car with RFID technology (in collaboration with Radio6ense) and inverter control optimization: “Optimizing Inverter Control Parameters and Thermal Mapping of a Formula SAE Car”.
Season 2025-2026. Dynamic characterization of torque constant of electric motors under real dynamic loads (in collaboration with Easting Electronics and Radio6ense: “Multiphysics characterization of Formula SAE car”.
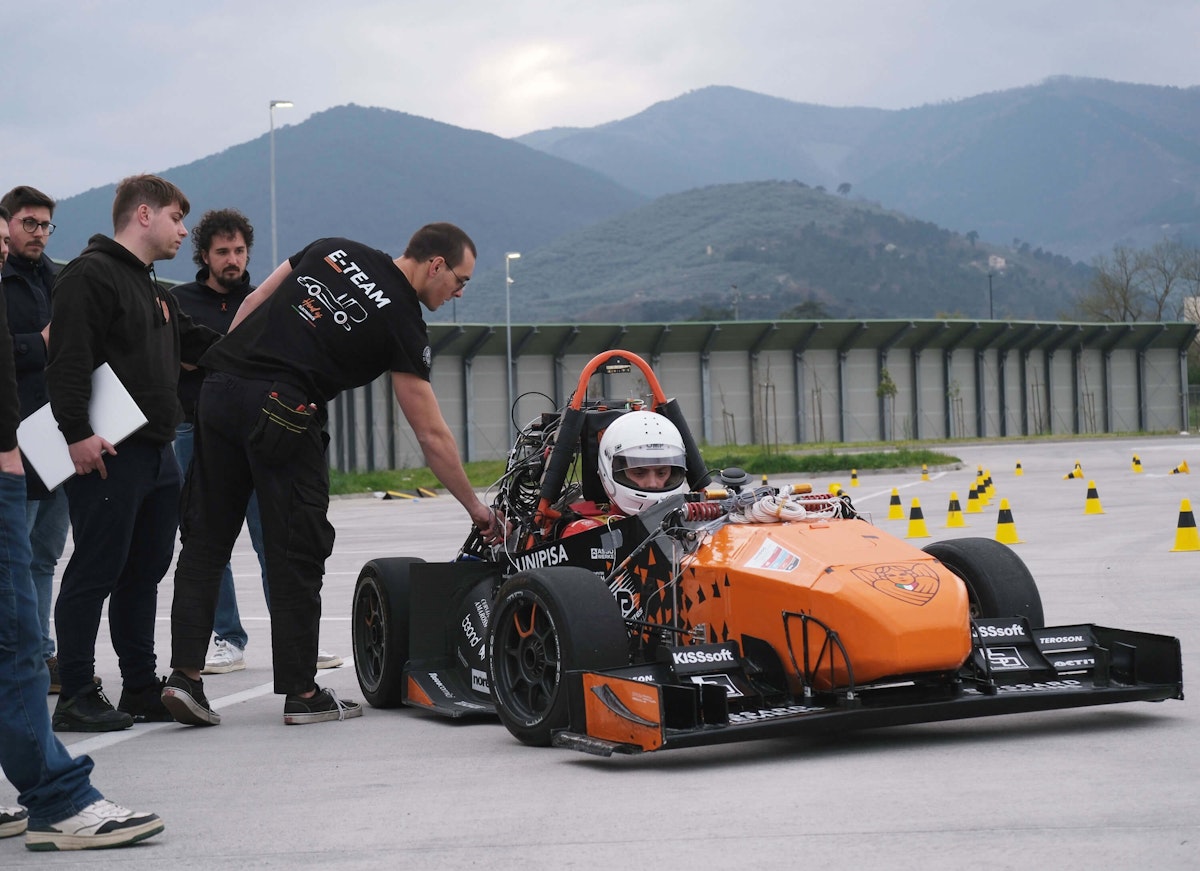
The third electric car of the team (ET-17) has a rear-wheel-drive propulsion system consisting of two axial-flow electric motors, with a maximum torque of 100 Nm and a maximum speed of 8000 rpm, powered by DTI HV-500 inverters. An 8 kWh battery with a maximum voltage of 600 V supplies power to the DC node. Figure 1 shows the car's powertrain.


Table 1 summarizes the main characteristics of the devices considered in this work.
| Specifications | Value |
|---|---|
| Nominal energy (kWh) | 8 |
| Voltage (V) | Min: 360; Nominal: 532.8; Max: 600 |
| Capacity (Ah) | 15 |
| Cells electrical configuration | 144s3p |
| Cell typology | Molicel P50B (NMC) – Cylindrical 21700 |
| Energy density (Wh/kg) | 167 |
| Motor – EMRAX 188 HV | |
| Torque (Nm) | Max: 100; Nominal: 50 |
| Current (A) | Max: 200; Nominal: 100 |
| Speed (rpm) | Max: 8000; Nominal: 5800 |
| Power (kW) | Max: 60; Rated: 35 |
| Cooling | Liquid |
| Weight (kg) | 7 |
The issue
The electrical and thermal models developed for the ET-17 electric powertrain could not be reliably validated using standard onboard instrumentation alone. In particular, the lack of high-bandwidth, synchronized measurements, such as accurate DC battery voltage and AC acquisition at the motor level, prevented a direct comparison between model predictions and real operating conditions.
Without dedicated measurement hardware, key quantities required for model validation remained unobservable, limiting confidence in simulation results and preventing the use of the models for control-oriented applications. Consequently, implementing these models within the real-time power management control unit was not feasible without prior experimental validation.
Accurate and synchronized electrical and thermal measurements were therefore required to assess model accuracy under dynamic load conditions and to enable their future on-board deployment for predictive power and thermal management strategies.
Methodology - analysis and solution
This work adopts a model-based approach supported by experimental measurements to validate dynamic models of the electric powertrain. The methodology focuses on the electrical modelling of the battery pack and the thermal modelling of the electric motor, selected for their relevance to real-time prediction and on-board implementation. Note that although we consider temperature dependence, it is imposed externally and cannot be updated. Future development of this work will also include thermal modelling of the battery pack.
Electrical battery model
We describe the electrical behavior of the battery pack using an equivalent circuit model (ECM), selected to balance physical interpretability, numerical robustness, and computational efficiency. We adopted a first-order RC model, consisting of an open-circuit voltage source, an ohmic resistance to account for instantaneous voltage drops, and a parallel RC branch to capture polarization and dynamic effects.
The model we adopted is shown in Figure 2, while the electrical constitutive equations are in (1)-(5). Note that although we consider temperature dependence, it is imposed externally and cannot be updated. Future development of this work will also include thermal modelling of the battery pack.


The model parameters were initially identified at the cell level through dedicated laboratory characterization tests, including capacity tests and Multiple Step Tests (MST) for power pulse characterization purposes (see Figure 3a), performed using the custom-developed setup visible in Figure 3b.
During the MST, the battery was subjected to controlled current steps at different state-of-charge levels, allowing the extraction of open-circuit voltage and dynamic parameters as functions of SoC. By repeating the test at different temperatures, we can accurately characterize the battery's temperature-dependent behavior. Given the strong influence of temperature on battery performance, this approach enhances model fidelity and ensures reliable predictions across the full range of operating conditions expected during competition.


The extracted parameters from the MST tests (see Figure 4) were subsequently scaled to pack level considering the series (Ns=144) and parallel (Np=3) configuration of the accumulator, according to equations (6)-(8).
Figure 4 shows the identified electrical parameters of the battery model as functions of state of charge and temperature. The open-circuit voltage primarily depends on SoC and exhibits only minor temperature variations over the investigated range, confirming its weak thermal sensitivity under the considered operating conditions.
Conversely, the ohmic resistance shows a strong temperature dependence, with significantly higher values at low temperatures, especially at low SoC. This behaviour highlights the dominant role of in capturing temperature-related losses and voltage drops during high current operation. The parameters and are more difficult to interpret individually and are strongly influenced by the identification process. From a practical standpoint, their combined effect, represented by the time constant , is more relevant, as it governs the battery's dynamic voltage response.


Motor thermal model
We modelled the thermal behavior of the electric motor using a lumped-parameter thermal network, developed to estimate the temperature evolution of the stator windings and surrounding structure. Owing to the motor's geometric and physical symmetry, the model focuses on a representative stator tooth, one of the 18 inside the motor, as shown in Figure 5, enabling a reduced-order formulation suitable for real-time applications.
We estimated the thermal parameters from motor geometry, material properties, and literature data, following the specifications visible in Table 2.


Motor materials properties
| Material | Conductive/convective heat coefficient (W/mK or W/m2K) | Specific thermal capacity (J/kgK) |
|---|---|---|
| Copper | 385 | 392 |
| Insulant (nylon) | 0.25 | 1600 |
| Aluminum | 167 | 896 |
| Iron | 80 | 449 |
| Water | 1000 | 4186 |
Motor geometric properties
| Column A | Value |
|---|---|
| Winding thickness (mm) | 3 |
| Insulation thickness (mm) | 0.5 |
| Aluminum hub axial size (mm) | 30 |
| Axial tooth size with winding and insulating (mm) | 45 |
| External motor radius (mm) | 90 |
| Internal motor radius (mm) | 55 |
| Circumferential distance between teeth (mm) | 6 |
| Cooling coil diameter (mm) | 12 |
| Radial distance between coil and water pipe (mm) | 5 |
| Single-phase electrical resistance measured (mΩ) | 15 |
Heat generation was assumed to originate exclusively from copper losses in the stator windings, computed from the measured RMS current and a temperature-dependent electrical resistance. This assumption is motivated by the fact that one of the dominant technical constraints of an electric motor is the maximum allowable temperature of the stator winding insulation, which ultimately defines the machine's thermal operating limits.
Additional loss mechanisms, such as iron and magnet losses, were neglected in this phase to preserve model simplicity and computational efficiency. Heat transfer was modelled through a series of thermal resistances and capacitances (see Figure 6a: the equivalent thermal circuit was reduced by half, considering the physical symmetry of the single tooth analyzed), representing conduction within the motor structure and convection toward the cooling circuit. The coolant temperature is imposed as a boundary condition because we didn’t explicitly model the cooling circuit using dynamic equations. The LPTN (Lumped Parameter Thermal Network) constitutive equations are given in (9)-(17).
The indices n and j denote the network’s generic thermal nodes. is the thermal capacitance of the node , with its mass and the specific heat capacity. , and represent thermal conductivity, heat transfer area, and conduction length, respectively, while ri and ro are the inner and outer radii for radial conduction.
For equivalent materials, such as winding and insulation, we used the conductive coefficient is the convective heat transfer coefficient, the thermal resistance between nodes, the nodal temperature, and the heat generation term.

 Lumped-parameter thermal network adopted for the EMRAX 188 HV motor, showing the discretized nodes and thermal resistances used to model heat generation and transfer. (b) Simulated temperature evolution of the model nodes under a constant-current condition corresponding to the maximum motor current, used as a consistency check of the thermal model.")
Figure 6b presents a consistency check of the motor thermal model by simulating a constant-current operating condition at the maximum motor current, with fixed TH2O=25°C. The simulation confirms that the relative temperature levels among the different nodes are physically consistent with the expected heat generation and heat transfer paths within the motor: the sections of the windings furthest from the cooling system are the hottest. This analysis serves as an internal consistency check of the model, as we estimated all thermal parameters a priori and performed no experimental calibration.
Experimental setup - implementation and equipment
We conducted the experimental activity on April 24, 2024, as part of a dedicated test campaign to simulate the Formula SAE endurance event under representative operating conditions. In Formula SAE, the endurance event represents the most demanding dynamic competition, as it simultaneously challenges reliability, efficiency, thermal management, energy strategy, and overall vehicle performance over an extended race distance.
The test was carried out at the Siena karting circuit and aimed at reproducing the electrical and mechanical load profiles associated with a full endurance race, corresponding to a total distance of approximately 22 km. The test program consisted of an initial system-check lap, followed by 10 consecutive laps simulating the first half of the endurance event. After a stop for driver change, we completed a second sequence of ten laps to reproduce the remaining portion of the race.
The main objective of the test was to characterize the electric powertrain during endurance operation and to acquire reliable data for model validation under sustained operation, including both transient and steady-state conditions. From an electrical standpoint, we required accurate measurements of voltage and current on both the DC side of the battery and the AC side of the motors.
Since the onboard telemetry system was limited to DC-side measurements and relied on estimations for AC quantities, external instrumentation was necessary. We therefore deployed the Dewesoft data acquisition systems to enable synchronized, high-bandwidth acquisition of the required electrical signals. In addition, high-accuracy voltage and current measurements across wide operating ranges were essential for validating the electrical battery model and ensuring consistency between experimental data and model predictions under realistic endurance-race conditions. Figures 7 and 8 show the implemented measurement setup.


Specifically, we used the following devices:
N°1 SIRIUS module. Model number: SIRIUSi-XHS-4xHV-4xLV.
N°1 SIRIUS extension module. Model number: Siriusi-PWR-MCT32.
N°3 current transducers DC-CT. Model number: D9m-D9f-5m-MCTS.
N°1 clamp current transducer. Model number: DS-CLAMP-150DC.
N°1 inertial measurement unit IMU. Model number: DS-IMU1.
N°1 mini-PC with DewesoftX.


Table 3 reports the main specifications of the used instrumentation.
| Device | Model | Key specs |
|---|---|---|
| Data acquisition system | SIRIUSi-XHS-4xHV-4xLV | Up to 15 MS/s/channel, 5 MHz bandwidth, ±2000 V range, alias-free up to 2 MS/s |
| DC transducer | D9m-D9f-5m-MCTS (DC-CT family) | DC up to 1000 A, AC up to ~700 A RMS, high bandwidth ~500 kHz+, galvanic isolation CAT II/III |
| Current clamp | DS-CLAMP-150DC | AC/DC up to ~150 A RMS, bandwidth ~100 kHz, Hall-effect sensor |
| IMU | DS-IMU1 | Multi-axis inertial measurement unit |
Measurements
The measurement campaign focused on acquiring high-fidelity electrical and thermal data under representative endurance operating conditions. Using the Dewesoft data acquisition system, we synchronously recorded all signals, enabling consistent time alignment between AC and DC power sides.
Figure 9 shows the three-phase motor currents and line-to-line voltages measured over a short interval of the endurance run, reported as instantaneous waveforms. Beyond providing the fundamental AC components, the high sampling rate clearly reveals the superimposed high-frequency content associated with inverter PWM switching. This detection is practically relevant because the switching-related ripple contributes to the effective RMS current, and therefore directly impacts copper losses and thermal loading.
For this reason, the availability of a high-bandwidth measurement of the AC side enables a more realistic estimation of loss-related indicators compared to low-rate, internally filtered onboard signals. Moreover, the simultaneous availability of instantaneous and RMS values (calculated in DewesoftX) allows the direct use of Irms as a robust input for the thermal model and for consistency checks across phases, supporting both model validation and quick diagnosis of potential imbalance or anomalous behavior.


Figure 10 presents the Dewesoft power analysis module during endurance operation, together with the GPS map of the Siena karting circuit. The synchronized visualization of electrical quantities and vehicle position allowed correlation between power demand and specific track sections, providing a clear understanding of load distribution during the simulated endurance event.


Figure 11 reports the DC-side electrical quantities used for battery model validation, including battery voltage, current, computed DC power, and state of charge. The wide dynamic range of the measurements ensured reliable validation of the electrical battery model across transient and steady-state operating conditions.

. We used these synchronized measurements to validate the electrical battery model.")
Results and discussion
We first assessed the validated electrical and thermal models using the experimental data acquired during the Siena endurance test campaign. The high-fidelity measurements obtained in that context provided the reference dataset for model validation under realistic operating conditions. Once validated, we applied the models to data collected during the FATA 2025 event to evaluate the extent to which we had exploited the full performance potential of the electric powertrain.
Figure 12 presents the validation of the electrical battery model under real endurance operating conditions. The comparison between the measured battery voltage acquired through the Dewesoft system and the voltage estimated by the equivalent circuit model shows strong agreement across both transient and steady-state phases. The mean absolute voltage error remained below 0.62%, with peak values around 2%.
We can observe that the measured voltage profile includes intervals with a value of zero. This phenomenon occurs because the DC-side voltage was measured downstream of the battery, at the DC link. Consequently, when we switched off the vehicle, the circuit de-energized, and the measured voltage dropped to zero.
In addition, the comparison between the calculated state of charge (based on coulomb counting of measured current) and the model-estimated SoC demonstrates consistent tracking over the entire endurance run, with a cumulative deviation below 0.34% at the end of the test. These results confirm the model's ability to reproduce the accumulator's electrical behavior under realistic load profiles.

, together with measured battery power and current profiles, and the comparison between measured and model-estimated battery voltage and state of charge.")
Figure 13 shows a comparison between the measured motor temperature and the temperature estimated by the lumped-parameter thermal model, along with the measured RMS current during the test. Despite the absence of dedicated parameter calibration tests, the model reproduces the dynamic evolution of winding temperature with satisfactory accuracy.
The maximum absolute temperature error remained below 4.8°C, while the medium deviation was limited to 2.9°C. The agreement between measured and estimated temperature trends confirms the internal consistency of the thermal network formulation and its suitability for predictive applications under endurance operating conditions.

 and thermal model prediction (blue) during endurance simulation.")
To quantify the potential performance margin, the validated electrical and thermal models were applied to the endurance dataset (FATA 2025) by progressively scaling the average battery power and the motor RMS current, while enforcing a minimum battery state of charge of 10% and a maximum motor temperature of 100 °C. Table 4 summarizes the key performance indicators analyzed in this study.
The optimized scenario corresponds to the maximum admissible operating point satisfying both electrical and thermal constraints. From a vehicle dynamics perspective, the relationship between average power and average speed is not linear. Under endurance conditions, where aerodynamic drag becomes significant, we can approximate the required traction power as P∝v3. In this regime, an increase in available average power of +8% corresponds to an approximate increase in average vehicle speed of:
A constant overall tractive efficiency was assumed; therefore, does not affect the relative speed gain, and we didn’t consider efficiency variations with operating point in this first-order estimate.
Endurance Performance Comparison
| Variable | FATA 2025 | Model-Optimized | Gain |
|---|---|---|---|
| Average battery power (kW) | 14.5 | 15.7 | 8% |
| Maximum motor temperature (°C) | 74 | 93 | +19°C |
| Average speed (km/h) | 43.1 | 44.2 | 2.6% |
| Endurance time (s) | 1791.95 | 1745.36 | -46.6 s |
Accordingly, the predicted increase in average battery power translates into an estimated reduction of total endurance time of approximately 47 seconds, computed from the corresponding increase in mean velocity over the race distance. We are aware that additional factors beyond powertrain capability, including tire grip, vehicle balance, aerodynamic efficiency, driver consistency, and race traffic, influence total endurance time.
Therefore, the estimated time gain represents a theoretical upper bound, assuming the vehicle was predominantly powertrain-limited in the analyzed scenario. Under this assumption, the results indicate that a measurable performance margin was available, and we could have exploited it through predictive, model-based power management.
This analysis highlights the transition from post-processing validation to predictive control: once validated through high-fidelity measurements, reduced-order models can move from offline analysis tools to active components of the vehicle power management strategy.
Conclusions
This work presented a measurement-driven validation of reduced-order electrical and thermal models for a Formula SAE electric powertrain. Through synchronized, high-bandwidth AC and DC measurements enabled by Dewesoft instrumentation, reliable data were acquired under realistic endurance conditions, bridging the gap between simulation and real vehicle operation.
The electrical battery model demonstrated voltage prediction errors below 2% and accurate SoC tracking over full endurance runs. Despite relying on parameter estimation rather than dedicated calibration tests, the thermal motor model reproduced the measured temperature evolution, with a maximum deviation of less than 4.8°C.
Beyond validation, applying the models to real competition data highlighted their potential to optimize predictive performance. Simulated scenarios suggest that we could safely explore controlled increases in operating limits, provided that we implement real-time monitoring and control strategies.
The results confirm that high-quality measurements are a key enabler for reliable model validation and that reduced-order models, when properly validated, can form the basis for future onboard predictive power and thermal management strategies in electric racing vehicles.