


Railway Bridge Structural Health Monitoring With Low-Noise MEMS Accelerometers

Daniel Colmenares & Gabriel Antonio del Pozo Alarcón
Norwegian University of Science and Technology
July 1, 2026
Europe’s aging railway bridges require reliable monitoring to detect early signs of structural damage. At the Hell Bridge Test Arena in Norway, researchers compared standard accelerometers with Dewesoft low-noise MEMS technology to evaluate how sensor quality improves vibration-based structural health monitoring and machine-learning-based damage detection.
Introduction
In this project, different accelerometers were compared using Power Spectral Density (PSD) analysis to evaluate how low-noise accelerometers influence the estimation of structural dynamic properties for damage detection and long-term monitoring.
The study included a finite element (FE) model of the bridge, an evaluation of the existing measurement system, a comparison with Dewesoft measurement devices, and a proposed design for a complete Dewesoft structural health monitoring system.
The project demonstrates the benefits of Dewesoft’s distributed measurement architecture for long-term monitoring applications, including faster installation, reduced cabling, improved electromagnetic immunity, lower implementation costs, and reduced infrastructure downtime. In Dewesoft monitoring systems, a single cable can carry power, signal, and synchronization, simplifying deployment across large structures.
Why aging railway bridges need continuous monitoring
A significant portion of Europe’s transport infrastructure is approaching or exceeding its original design life, making continuous monitoring critical for ensuring safety and functionality. As shown in Figure 1, for Norway, a large share of steel and stone bridges was constructed before 1960, with some exceeding a century in service.
The European Commission reports that many EU bridges face similar aging-related challenges, compounded by increased traffic loads, environmental stressors, and evolving safety requirements (Olofsson et al., 2005).
These conditions increase the risk of structural degradation, underscoring the need for advanced sensing technologies that can deliver continuous, high-resolution data. Such systems can enable early detection of anomalies, supporting predictive maintenance strategies that extend service life and reduce unplanned closures.

.")
Hell Bridge Test Arena: a real-world railway bridge benchmark
The Hell Bridge Test Arena (Figure 2) consists of a steel-riveted truss bridge constructed between 1902 and 1905.
Since 2016, the bridge has been out of service. Before that, it was part of the Hell-Sunnan Line, crossing the Steinkjerelva River at Hell Station in the village of Hell, about 30 km east of Trondheim.
The bridge is 35 m long and 4.5 m wide, with concrete foundations supporting it on both riverbanks.


As illustrated in Figure 3, the bridge’s framework consists of two side walls, a deck, and a network of lateral bracing. In 2020, the bridge played a central role in a large-scale experimental benchmark study (Svendsen et al., 2024).
Researchers introduced a series of controlled damage scenarios while continuously monitoring the structure’s performance. Figure 3 presents an overview of the types and locations of damage introduced to the bridge (DS 1 to DS 8). We examined four categories:
Damage in the connections between stringers and floor beams
Removal of stringer cross beams
Damage in lateral bracing connections
Damage in the connections linking the floor beams to the prominent load-bearing members
These represent the most frequently reported damage types in the literature, particularly fatigue-related deterioration occurring in and beneath the bridge deck. They are also among the most severe yet most relevant forms of damage for the type of bridge analyzed in that study.

.")

.")
Finite element analysis of the bridge
The finite element (FE) model was developed in ABAQUS using data from site inspections and technical drawings. It includes the bridge’s main structural components, such as the vertical walls, deck, and lateral bracing, as well as the deck’s secondary structure to support accurate damage detection.
Additional secondary and nonstructural elements were represented as lumped point masses on the deck to achieve a realistic mass distribution. A beam element approach was used. One end of the bridge was modeled as a simple support, constrained in the global x-, y-, and z-directions. The opposite end was modeled as a roller support, partially constrained in the global x-direction using spring elements and fully constrained in the y- and z-directions.
Figure 5 shows the resulting FE model of the bridge.


Experimental measurement setup
To evaluate the performance of the existing SHM system, measurements were collected from accelerometers installed in both local and global sensor configurations.
Existing measurement system
A National Instruments data acquisition system was used to collect acceleration data from two sensor groups installed on the bridge:
Sensor Group 1 (SG1) consisted of Dytran 3055D3 accelerometers, which measured the local vertical response of the bridge deck in the global z-direction.
Sensor Group 2 (SG2) included Dytran 3583BT and Dytran 3233A accelerometers, which measured the bridge’s global response in the lateral and vertical directions, corresponding to the global y- and z-directions.
Data were recorded at 400 Hz. Before analysis, the signals were detrended, low-pass filtered, and resampled to 100 Hz. Figure 5 shows the instrumentation layout.

.")
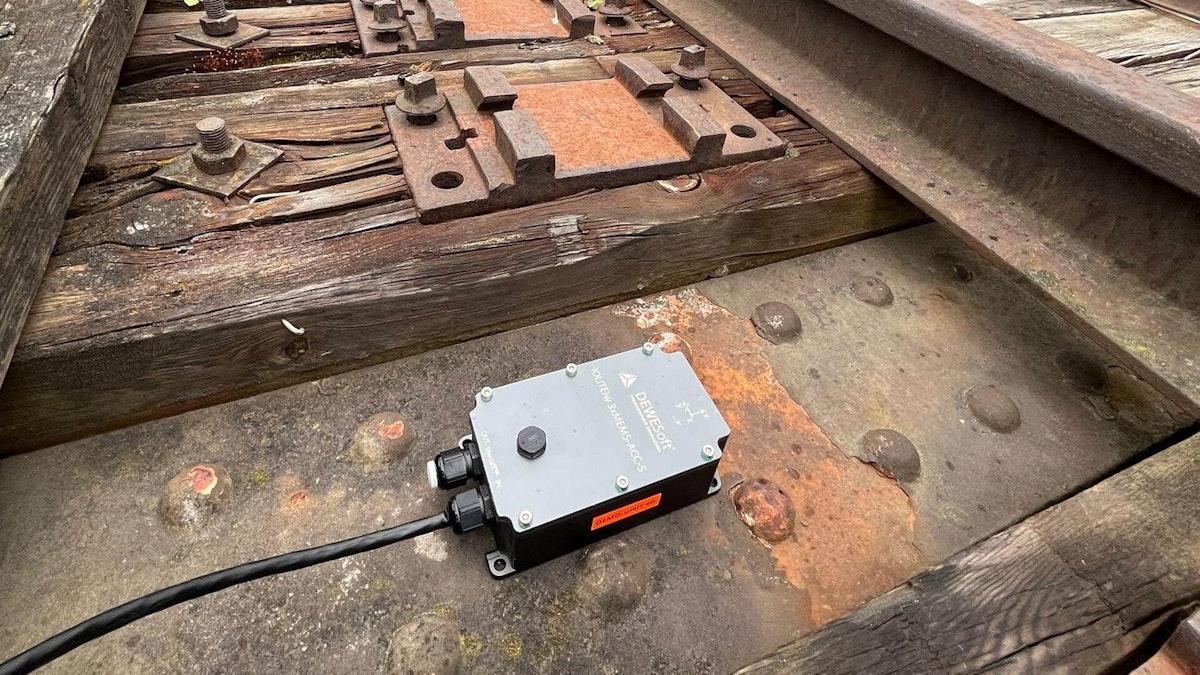
Dewesoft IOLITEi 3xMEMS measurement system
The IOLITE 3xMEMS sensors are IP67-rated, high performance accelerometers that form part of a family of data acquisition devices. They feature an embedded low noise triaxial MEMS accelerometer, analog-to-digital conversion, and an EtherCAT interface, all based on the IOLITE modular DAQ device platform.
The IOLITEi 3xMEMS sensors can measure the DC component of the acceleration field (gravity) and detect quasi-static accelerations as low as 0 Hz. The Dewesoft IOLITEi 3xMEMS-ACC devices have a very low noise performance.
The IOLITEi 3xMEMS-ACC has a 25 µg/√Hz spectral noise density while the IOLITEi 3xMEMS-ACC-S has an ultralow spectral noise density of 0,7 µg/√Hz. It is comparable to the best-in-class Force Balanced accelerometers, as shown in Figures 6 and 7. The waterproof IP67 chassis is available for all configurations and can operate over a wide temperature range from -50°C to 65°C.
Daisy-chained EtherCAT measurement lines
The IOLITE 3xMEMS are EtherCAT-based devices and are synchronized down to 1 μs device-to-device. This synchronization is critical when performing Operational Modal Analysis to understand structural dynamics, including natural frequencies, modal shapes, and damping ratios.
Multiple devices can be distributed across large structures and synchronized using a single cost-effective CAT6 cable. The devices are connected in a daisy-chain configuration, with up to 100 m between nodes.
A standard shielded Ethernet cable can be used, provided it meets the required specifications: SFTP CAT5e or higher, four twisted pairs, and a minimum conductor size of 24 AWG. This setup simplifies installation while maintaining reliable communication and synchronization across the measurement chain.
A passive PoE (Power over Ethernet) power injector merges the EtherCAT signal and power into a single cable. The IOLITE® power injector is an industrial power injector with embedded burst and surge protection electronics. Figure 8 shows a typical hardware configuration.

, and a ready-to-use EtherCAT measurement line of sensors.")
Large distances can be covered using a single CAT6 cable that spans up to 100m node-to-node and can be expanded to 200m using an IOLITE repeater, as shown in Figures 9 and 10.


Finally, by introducing a PoE EtherCAT switch, it is possible to achieve a star configuration that fully synchronizes multiple EtherCAT lines to within 1 microsecond, as shown in Figure 11.


Additionally, another Beckhoff switch can be easily daisy-chained, allowing the Dewesoft system to accommodate more elaborate configurations if necessary.
Integrating acceleration, strain, temperature, and displacement sensors
The Dewesoft system includes the IOLITE 1xSTG, a single-channel strain-gauge amplifier with internal quarter-, half-, and full-bridge configurations. Low-noise voltage and current source excitation are available with freely settable levels. Input ranges span from 50V to 100mV. Data is transferred over EtherCAT to a PC, enabling integration of multiple sensors within the same measurement chain, as shown in Figure 12.


Simplified installation with one cable for data, power, and sync
The Dewesoft system facilitates easy installation, as the EtherCAT cable enables multiple sensors and amplifiers to be connected in the same measurement chain, providing power, signal, and synchronization through a single cable, as shown in Figure 13.


In contrast to centralized systems, in which every single sensor needs to have its own analog (NO Electromagnetic Immunity) cable, and per channel, as shown in Figure 14. The Dewesoft system minimizes cabling.


Dewesoft system benefits for bridge monitoring
Installing the Dewesoft system results in many benefits, such as:
Minimizing cabling (less cost).
Minimizing installation time (less cost for the system integrator, fewer problems for the infrastructural owner).
Minimizing traffic downtime (less cost for the infrastructural owner and operator).
Electromagnetic immunity (high-quality signals even when power lines are around, such as in railway bridges).
High expandability of the system.
Synchronization to the microsecond.
Integration of any sensor.
Cloud capability for storing on servers and dashboards.
Alarm and triggering systems for early alerts, optimized data storage, and mathematical channels.
High level of reliability, integrating and synchronizing more than 100 sensors at the same time.
Figure 15 shows an example of a Dewesoft solution applied to the Hell Bridge. With a few EtherCAT measurement lines, we can integrate and synchronize multiple sensors, minimizing installation time, cabling, and electromagnetic interference.


Fast signal analysis in DewesoftX
DewesoftX data acquisition software enables immediate data analysis directly after measurement. In this case, Power Spectral Density (PSD) analysis was used for a quick data quality check, as shown in Figure 16.
The PSD was calculated using a Hanning window with 90% overlap and averaging, allowing the main frequency components and signal quality to be evaluated efficiently.


Machine learning for damage detection under ambient loading
One of the main challenges in vibration-based structural health monitoring is environmental and operational variability (EOV). Changes in temperature, humidity, wind, and operational loading can hide real damage signatures or create changes that look like damage. A well-known example is the I-40 bridge case, where temperature effects on modal frequencies masked the presence of actual structural damage.
One way to reduce the influence of EOV is to monitor the structure under more consistent loading conditions. Meixedo et al. (2021) showed that using repeatable reference train passages can help reduce variability caused by changing traffic and operational conditions. By focusing on repeatable events, it becomes easier to separate abnormal structural behavior from normal changes in the data.
At the Hell Bridge Test Arena (HBTA), a similar approach can be applied by analyzing data from specific low-activity time windows, such as 2:00 a.m. to 5:00 a.m., when wind is most likely the main excitation source. Under these conditions, low-noise sensors are essential for capturing high-quality vibration data.
To evaluate this, we compared the noise floor of the installed sensors with a new Dewesoft sensor designed for high sensitivity and very low noise performance. The Dewesoft sensor was installed on floor beam 4, closest to the north wall, as shown in the lower panel of Figure 17.
The Dewesoft sensor was then compared with the nearest installed sensors: the triaxial AG3 and the uniaxial AL11, AL12, and AL16. These sensors are highlighted with dashed magenta frames in the upper panels of Figure 17. The comparison was performed by visualizing the Power Spectral Densities (PSDs) of the collected data from both the Dewesoft sensor and the installed sensors, as shown in Figure 18.


When high-quality vibration data is collected using low-noise sensors, environmental and operational variability (EOV) is adequately accounted for, and advanced machine learning techniques are applied, it becomes possible to distinguish actual structural damage from normal variability.
Figure 19 illustrates how precise measurements, combined with advanced algorithms, enable the reliable detection of damage in bridges. The approach begins by modeling acceleration samples using autoregressive (AR) models, which capture the bridge’s dynamic behavior in a compact set of coefficients.
We then compared each acceleration sample pairwise using the Mahalanobis Squared Distance (MSD), a statistical metric that accounts for both feature locations and their correlations.
We processed the resulting distance matrix (see Figure 19) with HDBSCAN (Hierarchical and Density Based Clustering for Applications with Noise), a clustering algorithm that automatically groups similar patterns and labels them as “normal,” “outlier,” or “potentially damaged.”
When applied to the HBTA, where the bridge's actual condition is known, the method successfully separated undamaged and damaged states. As shown in Figure 19, all samples to the right of the red dashed line correspond to the damaged condition, and they are correctly labelled.

.")


Conclusion
The monitoring of the Hell Bridge Test Arena demonstrates the importance of sensor quality and advanced sensor technology in vibration-based structural health monitoring (SHM).
After introducing the bridge, its finite element model, and the experimental campaign, we compared the installed accelerometers with the Dewesoft IOLITEi 3xMEMS series. The results showed that a low noise floor is essential for capturing high-quality vibration data, especially under environmental and operational variability (EOV), one of the main challenges in SHM.
By combining low-noise measurements with advanced statistical modeling and machine learning techniques, it is possible to distinguish structural damage from normal variability using only ambient excitation, such as wind.
The ultralow noise floor of Dewesoft sensors, together with their ease of deployment and precise synchronization, meets the demanding requirements of bridge monitoring applications. This makes Dewesoft sensor technology well suited for robust, scalable, and cost-efficient monitoring solutions for aging bridge infrastructure.
References
I. Olofsson et al., “Assessment of European railway bridges for future traffic demands and longer lives – EC project ‘Sustainable Bridges,’” Struct. Infrastruct. Eng., vol. 1, no. 2, pp. 93–100, 2005, doi: 10.1080/15732470412331289396.
Frøseth, G. T., NTNU. (2019). Load model of historic traffic for fatigue life estimation of Norwegian railway bridges: Vol. 2019:73. NTNU, Faculty of Engineering, Department of Structural Engineering.
Farrar, C.R. and Worden, K. (2012). Structural Health Monitoring: A Machine Learning Perspective. John Wiley & Sons, Hoboken.
Svendsen, B. T., Frøseth, G. T., Øiseth, O., & Anders, R. (2025). A data set from an extensive experimental benchmark study of the Hell Bridge Test Arena subject to imposed damage [Data set]. Zenodo.
Del Pozo, G. A., Svendsen, B. T., & Øiseth, O. (2023). Implementation of decision analysis on a structural health monitoring system applied to a bridge benchmark study. Structural Health Monitoring 2023.
A. Meixedo, J. Santos, D. Ribeiro, R. Calçada, and M. D. Todd, “Damage detection in railway bridges using traffic-induced dynamic responses,” Eng. Struct., vol. 238, no. March 2021, doi: 10.1016/j.engstruct.2021.112189.