


Root Cause Analysis of a Francis Turbine Runner Crack
Damijan Cerinski, Ozren Orešković, Ozren Husnjak, Valentina Dervišević
Veski
April 7, 2026
A 135 MW pump-storage turbine experienced recurring cracking in the runner crown after more than four decades of operation, culminating in catastrophic failure that required full runner replacement. Continuous monitoring revealed a persistent 140 Hz vibration component linked to rotor–stator interaction, raising concerns about resonance within the runner structure. Experimental modal analysis confirmed that this operational excitation closely matched a natural vibration mode of the runner–shaft assembly, indicating resonance as a key contributor to crack initiation and propagation.
The cracking turbine runner underwent several repair interventions over time; however, the most recent incident resulted in irreversible damage, necessitating its complete replacement. The runner consists of seven blades and operates in combination with sixteen guide vanes.
An online monitoring system has continuously recorded key dynamic parameters, including relative shaft displacement, radial vibrations at the turbine guide bearing, and axial vibrations on the turbine cover.
The recorded data consistently showed a dominant vibration component at 140 Hz. This frequency corresponds to twice the product of the rotational frequency (10 Hz) and the number of runner blades (7).
The 140 Hz component was clearly identified in axial vibrations on the turbine cover, radial vibrations at the guide bearing, and in the relative shaft displacement signals, raising concerns about a possible resonance phenomenon contributing to the crown failures.
To investigate this hypothesis, an experimental modal analysis (bump test) of the turbine runner was conducted both with and without the shaft coupled to it. The objective was to determine the natural frequencies of the runner assembly and assess the potential for resonance under normal operating conditions.
The experimentally identified frequencies were subsequently compared with numerically predicted vibration modes. The results demonstrated a strong correlation between the measured 140 Hz excitation and one of the runner’s natural modes, indicating that resonance effects likely played a significant role in the development of the observed crown cracks.
Background
The 135 MW pumped-storage unit has been in service for more than 40 years. During its operating life, the turbine runner has experienced multiple cracking events in the crown, or upper plate, region. The unit operates at a nominal rotational speed of 600 rpm, or 10 Hz. The turbine runner is fitted with seven blades and operates in combination with sixteen guide vanes.
The most recent failure was initiated by the detachment of a portion of the runner crown, or top plate. At the time of failure, vibration levels at the turbine guide bearing (TGB) increased abruptly to critical values, resulting in the immediate shutdown of the machine. A visual inspection from the spiral casing, carried out before dismantling, revealed extensive crack propagation across the runner plate. The crack extended through the entire upper plate, as shown in Figure 1.
Following rotor disassembly, a detailed inspection confirmed that the crack originated at the outer edge of the upper plate and propagated toward the tip of one runner blade. The detached fragment, approximately 25 × 21 cm in size, was subsequently found in the draft tube. The extent of the structural damage rendered the runner irreparable, making further turbine operation impossible. As a result, complete replacement of the runner was required.


An online machine condition monitoring (MCM) system continuously tracks key dynamic parameters of the unit (as shown in Figure 2), including:
Relative shaft vibrations on UGB, LGB, and TGB
Absolute vibrations of UGB, LGB, and TGB
Absolute vibrations of the turbine cover
Axial displacement
Air gap in upper and lower stator planes
Magnetic flux
End winding vibrations
Stator core vibrations


Stakeholders
The investigation involved multiple parties with clearly defined technical and operational responsibilities:
Pumped Storage Plant Operator – responsible for ensuring safe operation, high availability, and long-term structural integrity.
Veski – provider of the machine condition monitioring system and responsible for advanced vibration diagnostics, root cause investigation, and development of recommendations for improving early crack detection capabilities.
Dewesoft – provider of measurement hardware and software used for experimental modal analysis.
The issue
The primary technical issue was to identify the root cause of the turbine runner failure, including assessing whether resonance effects were involved and establishing the structural and dynamic mechanisms responsible for the amplified vibration response and subsequent crack initiation and propagation.
Specifically, it was necessary to:
Identify the natural frequencies and corresponding vibration modes of the turbine runner, both in free and shaft-coupled configurations.
Establish whether the operational excitation at 140 Hz coincided with, or was sufficiently close to, a structural natural frequency.
Define improvements to the existing MCM system to enable early detection of turbine runner crack initiation and propagation.
Data analysis
Global vibration parameters gathered from the machine condition monitoring system over the past two years were stable and did not indicate a breakdown. However, relative vibrations started to increase slowly in the period 1-2 months before the damage.
These changes were at all times within the permitted vibration levels until the damage occurred and did not require the activation of warnings or alarms in accordance with the applicable vibration standards for hydro power plants. As illustrated by the two-year trend in Figure 3, the data revealed a progressive increase in shaft unbalance, attributed to crack propagation in the turbine runner under sustained cyclic stress from pressure pulsations.


During normal operation (before any issues with the turbine runner), the monitoring system detected a dominant amplitude at 140 Hz – twice the multiple of the nominal frequency (10 Hz) and the number of runner blades (7)- due to rotor-stator interaction (RSI) in the turbine. This frequency was present in axial vibrations on the turbine cover, radial absolute vibrations, and relative shaft displacement on the TGB.
Notably, an additional peak at 160 Hz was observed in the spectrum later, with very low amplitude, aligned with the guide vane blades' passing frequency: 16 blades multiplied by the nominal frequency of 10 Hz (see Figure 4). Before the crack, vibrations at this frequency were not considered critical due to their low amplitudes and occasional appearance, e.g., only in generator mode.
However, after the failure, post-processing analysis showed that the crack had initiated the higher vibrations at this frequency. This crack introduces non-uniform loading, thereby amplifying the influence of the guide vane interaction on the vibration response. Harmonics at 150 Hz, 170 Hz, and 180 Hz appear because of the modulation created by the 16x harmonic.

.")
The main conclusion from the frequency analysis was that, during the unit operation, the turbine runner resonant frequency is near 140 Hz. Therefore, it can be concluded that the runner vibrates continuously at this frequency under high-load operation.
These continuous vibrations were likely the cause of dynamic stresses, and the consequence of these stresses is the appearance of a crack and its propagation until final breakdown. Therefore, there is a real possibility that after several years of operation, similar damage will reappear if the same turbine runner design is used under similar working conditions.
To assess the potential for resonance during normal turbine operation, a bump test was conducted to determine the turbine runner's natural frequencies. Findings from this work would explain the correlation between the observed 140 Hz excitation and a natural vibration mode of the runner structure, indicating that resonance may have contributed to the observed crown failure.
Identification and measurement
To determine the root cause of the turbine runner failure and verify the suspected resonance mechanism, it was decided to perform an experimental modal analysis using the so-called bump test. The objective of the modal analysis was to identify the natural frequencies and corresponding vibration modes of the turbine runner and to evaluate their relation to the 140 Hz operational excitation observed during normal unit operation.
The investigation was conducted in two stages:
Free turbine runner configuration
Turbine runner coupled to the shaft
This two-step approach enabled clear differentiation between the intrinsic dynamic characteristics of the runner and the behaviour of the complete runner–shaft assembly, thereby identifying vibration modes that could potentially lead to resonance under operational conditions.
Within the measurement, the runner was excited by impulse excitation with a rubber hammer to induce vibrations. An accelerometer was attached to the hammer, and the impact force was calculated as the product of the hammer mass (1.2 kg) and the measured acceleration.
Further, a variety of accelerometers were attached at different locations and measured the acceleration at the locations where each sensor was placed. For the acquisition of analogue signals, a portable data acquisition unit (Obsidian) was used. After data acquisition, digital signals were analysed on the measurement laptop running a DewesoftX diagnostic software.
Free turbine runner measurement
Given the limited number of sensors used during the measurement and to cover as large a surface area as possible of the turbine runner, the measurements were made in 3 configurations. In each configuration, one sensor (sensor #8) remained in place and served as a phase reference, while the other sensors were moved. Figure 5 shows a schematic representation with photos of each configuration.
We also used sensor labels in the analysis of results. In the first configuration, sensors were positioned around the outer runner edge at the tip of blades (7 blades). In the second configuration, sensors were again placed around the outer edge of the turbine runner, but between the blade tips. In the last, and third configuration, 4 sensors were repositioned on the outer runner edge at the tip blades, and 3 sensors were positioned on the inner edge of the runner plate.
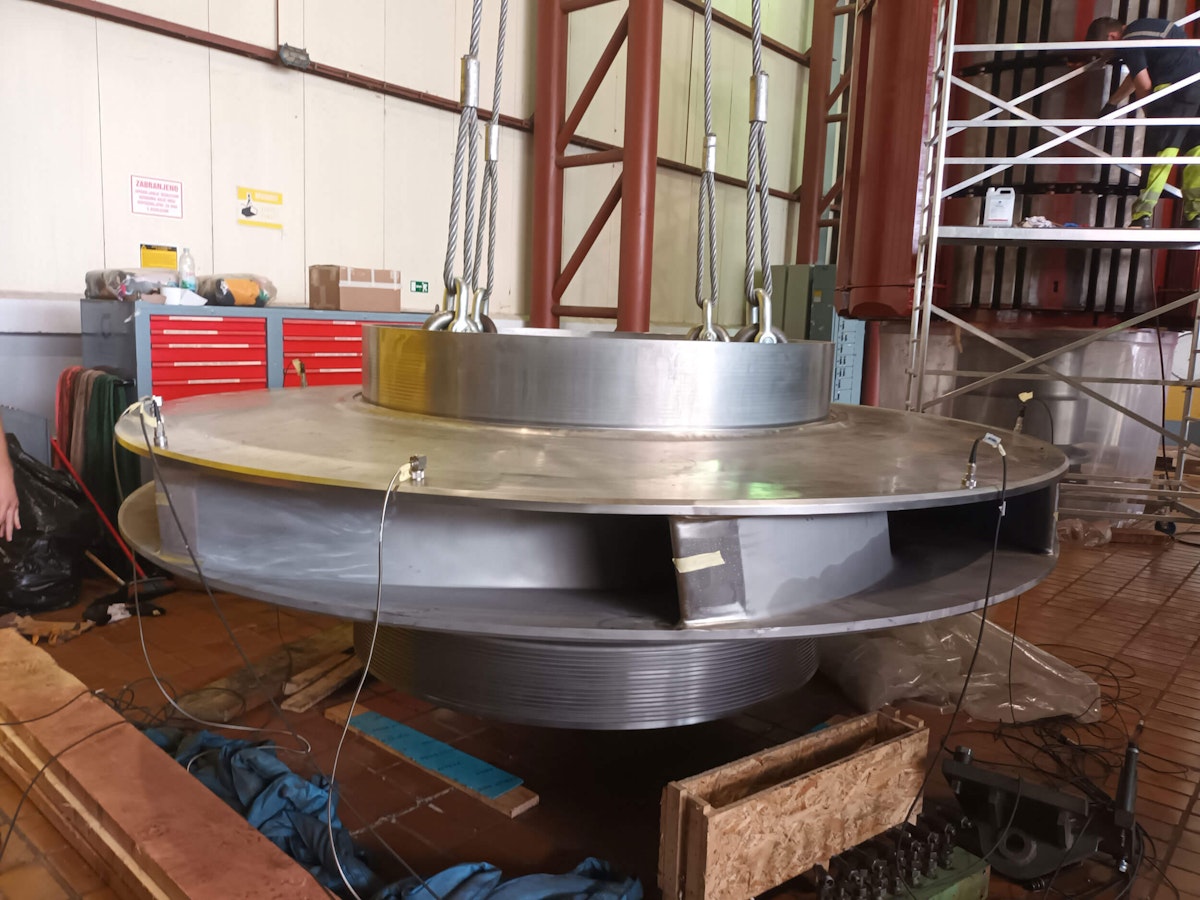
All measurements were performed with the turbine runner lifted to a height of about half a meter using steel cables to simulate boundary conditions of a free turbine runner to identify natural frequencies that are exclusively a property of the runner.


Turbine runner coupled to the shaft
In the second measurement, the turbine runner's natural frequencies were measured after the runner was coupled to the shaft. Two measurements were made: first, the sensors were placed at the bottom of the turbine runner, accessed from the draft tube (see Figure 6), and a bump test was carried out. Afterwards, sensors were placed directly on the shaft above the turbine (see Figure 7), and the bump test was repeated.


Data acquisition equipment
The experimental modal analysis was performed using the following measurement and excitation equipment (see Figure 8):
Impact hammer for impulse excitation
CTC accelerometers for vibration response measurement
OBSIDIAN – embedded DAQ computer
DewesoftX – diagnostic software


Test results
Modal analysis of the free turbine runner
To determine the natural frequencies, a spectral analysis of recorded waveforms was made. Figure 9 shows the spectral analysis of the first measurement configuration up to 1 kHz, and it is evident that the turbine runner exhibits multiple natural frequencies within the displayed frequency range. The first three natural frequencies observed in the spectrum were analysed.


Figure 10 shows the spectral analysis for all three measurement configurations in the 200–400 Hz frequency range. From the spectral analysis, the first three natural frequencies are 257 Hz, 258.5 Hz, and 329 Hz, and the corresponding vibration modes have been calculated.
It is important to note that the first two natural frequencies are very close: 257 Hz and 258.5 Hz. These two closely spaced frequencies result from structural stiffness asymmetry around the circumference of the turbine runner. For that reason, it is necessary to analyse these two frequencies separately.


To obtain vibrational modes, the transfer function values of 7 sensors relative to sensor 8 have been calculated for the first three natural frequencies across all three measurement configurations, and the results have been combined. In the third measurement configuration, sensors 1'', 3'', 4'', and 6'' were positioned in the same locations as in the first two configurations, and these positions were not shown in the results because the values were repeatable.
The calculated vibration modes are graphically displayed for all three configurations in Figure 11. Analysing the 257 Hz frequency showed that sensors at positions 3 and 3’ are in phase with sensors 7 and 7’, respectively. While the sensors at 2 and 2’ are in phase with the sensors at 5 and 5’, respectively.
Similar behaviour is recorded at a near-frequency of 258.5 Hz; again, the opposite sides of the turbine runner are in phase. Specifically, sensors 1 and 1' are in the phase with sensors 4 and 4', and sensors 6 and 6' are in the phase with sensors 3 and 3'.
While observing the vibration mode at 329 Hz, it can be seen that vibrations on the outer circumference of the turbine runner are in phase (sensors from 1 to 7). In contrast, on the inner circumference they are extremely small (sensors 2'', 5'' and 7''), meaning that these positions almost standing still at a frequency of 329 Hz.
It is clearly visible that only symmetric vibration modes were recorded. Excitation of asymmetric vibration modes requires a structural element (shaft) capable of generating moments, which was not the case in this setup.

It is important to note that this measurement identifies the natural frequencies of the free turbine runner, which is suspended only by metal cables and is therefore minimally constrained by its surroundings.
Once the runner is connected to the shaft, it will form a completely different system, and its natural frequencies will change. A new natural frequency is expected below 257 Hz, which is currently the lowest natural frequency measured for the free runner suspended on metal cables.
This shift is expected because, after assembly, the runner and shaft will vibrate as a single body with greater mass and a different stiffness and inertia distribution.
However, some of their natural frequencies will remain similar. An example of this is the vibration mode at 329 Hz. This vibration mode and the corresponding natural frequency will remain almost the same even after connecting with the shaft.
This is confirmed by the vibrations measured at points along the inner edge of the runner, specifically positions 2”, 5”, and 7”, where the amplitudes are very small, almost zero, and the phase is the same at all three locations.
Because these points are very close to the edge, they effectively represent the boundary conditions of the free runner’s vibrations.
When the runner is coupled to the shaft in this area, the boundary conditions are expected to remain nearly unchanged, meaning that the vibrations should still have very small amplitudes and occur in the same phase.
Turbine runner connected to the shaft
For the spectrum calculation, a waveform block length of 0.5 s was used, yielding a spectral resolution of 2 Hz. The chosen spectrum resolution is suitable for the runner-shaft coupling, which, in turn, yields a short impact response duration. The frequency range up to 400 Hz was analysed, which is the area of interest.
During the measurement, another unit in the power plant was operating, and vibration components transferred from that unit were visible in the spectrum. To obtain a clear picture of the frequency components that originate exclusively from hammer excitation and which are the actual natural frequencies, the spectrum with no excitation was subtracted from the spectrum obtained with the excitation.
Figure 12 shows the spectrum analysis before and after the influence of the other unit is subtracted. A frequency component at 100 Hz is generated by stator vibrations of the other unit, which is transferred through the foundation structure to the measured unit, and from the turbine housing to the rotor shaft, all the way to the turbine runner. In the area around 100 Hz, a local resonance occurs, causing increased vibrational response.
Since the spectra with and without hammer excitation were recorded at different times, subtracting all frequency components around 100 Hz did not eliminate them. In the spectrum analysis after the influence of the other unit was minimised, 3 frequency components were clearly obtained: about 174 Hz, 300 Hz, and 356 Hz. These three frequencies represent the turbine runner's natural frequencies when connected to the shaft.


The same correction procedure was performed using direct measurement of the shaft, and the spectra before and after correction are shown in Figure 13. It is again evident that frequency components around 100 Hz could not be eliminated for the same reason explained earlier, and they will not be considered here.
On the other hand, the natural frequencies of the turbine-shaft system are clearly visible after the correction, at about 174 Hz and 375 Hz. The 300 Hz frequency, recorded on the turbine runner, is not visible on the shaft. This was expected, as stated in the previous chapter, and a detailed discussion about the vibration modes will follow.


The main question that arises is which boundary conditions define the vibration modes of the free turbine runner, and which after the runner is coupled to the shaft?
When both the outer and inner runner edges are free, all forces and torques at the edges are equal to zero. With such boundary conditions, the natural vibration modes of the freely suspended runner cannot include asymmetric modes but only symmetric modes. This was shown in free runner analysis, where only the frequencies 257 Hz (and the near frequency 258.5 Hz) and 329 Hz were recorded, both representing symmetrical modes of vibration.
The free turbine runner shows a small damping factor, and as a consequence, vibrations decay only after several seconds. Consequently, the spectral response components are very narrow.
While observing the vibration mode at 257 Hz, the inner edge phase changes in response to the outer edge's corresponding phase changes (see Figure 11). This vibration mode will change once the turbine rotor is connected to the shaft. In the vibration mode at 329 Hz, the outer edge vibrates in-phase at all points, as does the inner edge.
However, the inner edge vibrates in counter-phase relative to the outer edge (see Figure 11), with amplitudes about 10–15 times smaller. This vibration form will also be present after connecting the runner with the shaft, in almost the same mode, but its natural frequency will increase due to the change in boundary conditions at the inner edge.
After the turbine runner is connected to the shaft, the boundary conditions at the inner edge are defined by the absence of displacements and rotations at all points of the inner edge. The lowest natural frequency of the connected shaft and runner occurs at 174 Hz, about 80 Hz lower than that of the freely suspended turbine runner. This is a new vibration mode that does not appear when the runner is free.
Furthermore, damping of the mounted rotor vibrations at 174, 356, and 374 Hz is significantly greater than damping at 300 Hz. This is visible in the width of the spectral component at 300 Hz, which is practically the same as for the freely suspended runner across all spectral components.
This raises the question of why the damping differs at certain natural frequencies.
To answer this, the natural frequency at 300 Hz was analyzed. At this frequency, vibrations of the turbine runner are not transmitted to the shaft. Likewise, excitation from the shaft cannot induce vibrations at 300 Hz, as clearly shown in Figure 13.
As a result, the runner is subject to the same damping conditions as in the freely suspended state.
Based on this, it can be concluded that vibrations at 300 Hz correspond to the lowest symmetric mode. For the free turbine runner, the lowest symmetrical natural frequency is 257.5 Hz, while for the connected runner and shaft, it is 300 Hz. This increase is due to higher stiffness at the inner edge resulting from the runner–shaft coupling.
In the next symmetrical vibration mode (free runner 327 Hz), the shaft can only vibrate axially, while runner flexural vibrations cannot be transmitted to the shaft. The natural frequency of this mode can only be higher than that of the suspended rotor.
Therefore, the lowest natural frequency of the coupled runner and shaft system, 174 Hz, cannot be associated with any symmetric vibration mode. It can therefore be concluded that 174 Hz corresponds to the lowest asymmetric natural vibration mode.
During plant operation, when the turbine runner is filled with water, this natural frequency may decrease and approach 140 Hz, potentially bringing the turbine rotor into resonance. Vibrations at 174 Hz are observed in both the turbine runner and the shaft under impact excitation, regardless of whether the excitation is applied to the runner or directly to the shaft.
This clearly indicates that the corresponding vibration mode involves both the turbine runner and the entire shaft. The resonance frequency at 140 Hz corresponds to two times the multiple of the turbine nominal frequency of 10 Hz and the number of turbine blades, which is seven, as explained earlier.
It should also be noted that, during the measurements, the turbine runner was stationary and directly supported by the axial bearing and by the segments or seals in the TGB. During operation, however, the runner is lifted from these contact points by the oil film formed in the bearings. This static support produces higher damping in the decay response. During rotation, lower damping is expected, which increases the influence of resonant forces associated with the lowest asymmetric vibration mode.
This interpretation is further supported by the presence of a 140 Hz component in the relative vibrations at both the upper guide bearing (UGB) and the lower guide bearing (LGB), with amplitudes greater than those of the bearing displacements. These results indicate that the shaft and turbine runner vibrate in the turbine runner’s lowest asymmetric mode, measured at 174 Hz, with the frequency slightly reduced by the added mass of water.
The lowest asymmetric vibration mode at 174 Hz observed during this measurement campaign could not be reproduced in finite element method (FEM) simulations of the turbine runner alone, without the complete shaft. In general, this mode can only be captured in FEM analysis if the numerical model includes the turbine runner, the complete shaft, and the generator rotor, since all of these components are essential for an accurate representation of this vibration mode.
Additional improvements to the monitoring system
Based on the presented results, it was recommended to upgrade the existing MCM system by extending the analysis to include amplitude and phase calculations for all harmonics identified in the spectra, as shown in Figure 4.
Particular attention was given to frequencies around 160 Hz, 170 Hz, and 180 Hz in the relative and absolute vibration signals of the UGB, LGB, and TGB, as well as in the absolute vibration signals of the turbine housing.
The trend records were also expanded to include the mean square values at these frequencies, reported as root mean square values.
Pressure sensors were also installed in the turbine area, specifically in the penstock, spiral casing, turbine cover, draft tube, and vacuum zones, together with a strain sensor mounted on the turbine cover.
All of the above dynamic value calculations were applied to the pressure signals from the turbine area and integrated into the MCM system.
Figure 14 shows the RMS trends of the selected frequencies over the past three months for turbine bearing and casing absolute vibrations, spiral casing pressure, and strain measurements, together with the corresponding rotational speed and active and reactive power.
These indicators will enable early detection of rotor cracks, allowing repair interventions while the plant remains operational. Furthermore, it was recommended to integrate the alarm thresholds derived from the MCM system into the SCADA system to provide preventive warnings when vibration levels exceed thresholds.

 of turbine bearing and casing absolute vibrations, spiral casing pressure, and strain measurement with corresponding rotational speed, active and reactive power for the past 3 months.")
Conclusion
A bump test was performed on the turbine runner before and after coupling to the shaft to identify its natural frequencies and evaluate the potential for resonance under normal operating conditions.
Upon coupling the turbine runner to the shaft, a redistribution of stiffness and inertia occurred compared to the free turbine runner, and the system was therefore analysed as a combined runner–shaft system. The analysis identified the natural frequencies as 174 Hz, 300 Hz, 356 Hz, and 375 Hz.
The 300 Hz frequency corresponds to the lowest symmetric vibration mode. Since this mode does not induce shaft flexural vibrations, the damping of this response is lower than at the frequencies 174, 356, and 375 Hz, where shaft flexural vibrations are present.
The frequency at 174 Hz corresponds to the first asymmetric vibration mode, in which both turbine runner and shaft flexural vibrations are excited. When the turbine runner is filled with water, this natural frequency may decrease, potentially bringing the turbine runner into resonance at 140 Hz. This frequency corresponds to the product of twice the multiple turbine nominal frequency (10 Hz) and the number of runner blades (7).
During the unit operation, a reduction in vibration damping is expected because the turbine runner lifts from the contact points with the axial bearing and the turbine bearing segments during rotation. If damping decreases under these conditions, an increased resonant response of the turbine runner may occur, which could explain the turbine crown failure.
The recommendation is to upgrade the existing MCM system by expanding the analysis to include amplitude and phase calculations at the key frequencies of 160 Hz, 170 Hz, and 180 Hz. The root mean square values at these frequencies should also be added to the trend records.
In addition, pressure sensors have been installed in the turbine area, and the same dynamic analysis should be applied to those signals.
These upgrades would make it possible to detect turbine runner cracks at an early stage. By adding alarm thresholds to the SCADA system, the system could also issue preventive warnings before vibration levels become too high.