


Testing Combustion Performance on Rocket Propulsion System
Álvaro Teijeiro Montoro and Alberto Pérez Gallardo
Valencia Polytechnic University (UPV)
April 16, 2026
Rocket propulsion testing demands precise measurement in extreme conditions. Intense heat, vibration, and rapid combustion events often exceed the limits of conventional data acquisition systems.
To improve static fire testing, Faraday Rocketry UPV implemented an integrated Dewesoft data acquisition solution. The team captured high-quality thrust and temperature data, reduced ignition time, and gained more reliable insight into the performance of its student-developed rocket motor.
Introduction
The aerospace industry, specifically the rocketry field, involves complex design, extensive testing, and the operation of systems that propel launch vehicles. Data acquisition (DAQ) is crucial in this domain, particularly during ground testing and flight experiments. Propulsion systems must perform flawlessly under extreme conditions, and the data collected throughout development is essential to ensuring safety, efficiency, and performance.
Data acquisition in rocket propulsion faces several unique challenges. The sensors must operate in harsh conditions—exposed to intense heat, vibration, and electromagnetic interference—requiring robust, resilient equipment. High-speed data capture is another essential requirement, as the dynamic nature of combustion and thrust generation demands high sampling rates. Furthermore, integrating multiple sensor types—such as thermocouples, pressure transducers, and accelerometers—requires precise synchronization to ensure that all data points temporally align for meaningful analysis.
We will explain how we used Dewesoft hardware in static fire testing. We will review previous attempts to collect thrust and temperature data and the challenges they posed for the Propulsion Department.
Then, we will propose an acquisition system based on the Sirius hardware and explain how both the hardware and software are configured. Finally, after fire rehearsals, this case study will analyze and post-process the test results to compare the ergonomics, feasibility, and reliability of the different acquisition systems.
In parallel, we will discuss a new approach to a long-standing flaw in our rocket motor, how we addressed it, and how Dewesoft and its products helped us achieve a surprising upgrade.
Who is Faraday Rocketry
Faraday Rocketry UPV started in 2021 as the first rocketry university team at the Universitat Politècnica de València. Since its inception, the team has successfully developed several sounding rockets, including Aspera and Astra in 2022.
Notably, Astra participated in Europe’s most prestigious sounding rocket competition, the European Rocketry Challenge. In 2023, the team competed in EuRoC with another rocket, Genesis, which won the Flight Award.
Our latest series of competition-sounding rockets, Rompetechos and Skybraker, were launched in the second half of 2025, with the last one competing in EuRoC 2025 and winning our second Flight Award.
Right now, the team is engaged in its mission to reach the Karman line at 100km above sea level, the boundary that separates Earth from outer space. The team's vision is that Europe has the potential to compete in the New Space race, and we are the generation with the will and ability to make that possible.
The first rocket in our “Karman line” series, Origin, launched last February, allowed us to put critical technology to the test and will be the first step toward further escalating our rockets, each time closer to the space frontier.
A reliable and robust propulsion system is essential to ensure the successful launch of these rockets. In this regard, the Propulsion Department plays a critical role, ensuring that the rocket motor meets the necessary thrust and total impulse requirements without affecting other components. This task includes maintaining vibrational compatibility with elements such as the airframe and avionics bay, respecting weight limits, and performing these tasks without thermally compromising the rocket.
In the team's first years, the Propulsion Department relied on Commercial-Off-The-Shelf (COTS) motors. We bought those motors from specialized manufacturers, which offered a moderately cheap and reliable source of rocket motors. As the team grew, so did its propulsion requirements and ambitions. The department started a project to achieve its intentions while upgrading its knowledge and capabilities: the development of an SRAD (Student Researched and Developed) rocket motor, designed, manufactured, tested, and certified by the team members - the only way to make our objectives come to reality.


The issues of static fire test
Static fire tests are one of the most (if not the most) critical steps to reach a safe, reliable, and successful SRAD rocket motor development. It consists of a controlled static ignition and a complete combustion of a fully mounted prototype in a workbench designed by the team for that purpose.

In this regard, the second-stage rocket motor from Origin, called LF75, needed to be subjected to flight-like conditions, namely a static fire test.
The team considered several aspects and issues. The first one is obtaining data regarding thrust force, total impulse, and specific impulse. These three key metrics are the best way to determine whether a rocket motor exhibits the expected behavior and to assess its performance. It’s the main purpose of carrying out a static fire test.
However, the most problematic aspect our team has faced in the SRAD rocket motor development is controlling and reducing ignition time. LF75 is a second-stage “sustainer” motor, designed to ignite right after stage separation at a precise instant. Right now, the timing of that ignition can compromise not only the flight apogee but also the entire operation, making the mission potentially catastrophic.
The team needs the lowest possible ignition time. When we send the ignition signal from the flight computer, the motor has to start immediately. Immediate ignition also simplifies the calculations required to achieve perfect stage separation, one of the key milestones in Origin’s launch and vital for the development of the Karman development line.
Analysis - theoretical concepts
Thrust-related formulae
Total impulse IT is the thrust force F (which may vary over time) integrated over the time t:
This total impulse measure is, in essence, proportional to the total energy released by the propellant.
Additionally, specific impulse IS represents the thrust per unit propellant “weight” flow rate:
Which, for a solid rocket motor, can be represented as:
Where is the gravity acceleration value at sea level, is the propellant mass flow rate, and w is the propellant weight. This equation is a figure of merit for the performance of any rocket propulsion system, as is a concept equivalent to liters per 100 kilometers, applied to automobiles. A higher value often indicates better performance.
Ignition time
The igniter is the spark that turns the motor on. It provides the initial thermal energy to the propellant mixture, allowing it to maintain combustion on its own.


The current igniter setup we use is a hollow cylinder introduced from the top of the motor, filled with a thermite composite and an e-match to start the ignition.


This setup is then sealed with masking tape, enough to prevent the mixture from leaving its place, but easily burned when ignition begins.
From previous data, we know that the ignition time is around 2 seconds. Watch the video below:
This value is too large to ensure a safe and reliable stage separation, so the team had to find a solution.
Thermodynamics Considerations
There are, primarily, three considerations that determine how quickly the ignition begins the nominal combustion:
1. The igniter mass. Increasing it means there are more high-temperature particles in the combustion chamber, leading to more simultaneous local combustion initiations. However, if you add too much, the explosion might damage or fracture the solid propellant, which could end in a non-nominal flight or even a CATO.
2. The buildup pressure. The pressure that the igniter can manage to generate and maintain is vital, as it is directly related to the combustion velocity by Saint Robert’s Law:
Where a and n are determined experimentally, and r is the combustion velocity.
3. The particle distribution. How the hot particles distribute initially in the chamber also plays a vital role in starting the motor. If their distribution is more homogeneous, the locally initiated combustion is well distributed, avoiding incomplete combustion and the feared “chuffing”.
Also, increased pressure raises the temperature, which always makes it easier to initiate combustion. Finally, an increase in pressure and local combustion from the hot thermite reaction increases combustion velocity, which in turn increases pressure. Like this, we finally achieve motor start, and the combustion is homogeneous in the entire combustion chamber.
As a reference, the pressure build-up during ignition in the previous fire test, as shown in the video above, is estimated to be around 2-3 bar, depending on the igniter mass.
The previous data acquisition setup
The setup of the previous acquisition system was composed of these sensors:
A Kistler piezoelectric force sensor (model 9103C).
Two general-purpose thermocouples.
We connected the force sensor to one externally powered, analog-calibrated amplifier, using a ruler to adjust the sensor's sensitivity. Then, the amplifier provided a voltage signal to a Kistler acquisition system via a BNC cable, which processed the data from the sensor and sent it to the PC, where it was displayed and stored. Then, it would be necessary to process the sensor data, export it to Excel, and analyze it using MATLAB scripts (numerical integration, signal filtering, etc.).
We obtained thermal data with thermocouples and stored it in parallel on an external acquisition system; this data had to be collected after the test using a PC; there was no live temperature display.
This setup featured several key flaws that made data acquisition a challenging and somewhat unreliable task:
The system linked several components and concatenated connections of different kinds (sensors, amplifiers, DAQ system, and PC), which complicated the setup labor and introduced noise to the signal.
Our use of analogically calibrated amplifiers increased the uncertainty in sensitivity. Also, the external alimentation of these amplifiers introduced a significant, continuous signal drift that continuously altered the DAQ system’s lecture throughout the test. This error was inevitable, even with an offset. Finally, they had to stay connected for 24 hours to “warm up” before the test, which introduced an extra level of difficulty.
As the data was raw, recorded with the Kistler DAQ system, we could not measure, visualize, or process it with an implemented tool. Hence, the design of several post-processing MATLAB scripts required deep coding knowledge, and the measurements were not highly accurate because the scripts were somewhat rudimentary. Furthermore, a previous Excel reorganization was required, introducing another step to the already extensive list of assignments.
The new data acquisition solution
As we have studied, the main objective is to solve the following problems:
Reduce the system’s complexity to reduce noise and obtain a more straightforward assembly.
Improve the reliability of the amplifiers and adapter while reducing noise generated by the external alimentation.
Enhancing the post-process labor, upgrading the data storage, visualization, treatment, and numerical methods.
Obtaining useful and reliable data, regarding thrust, total and specific impulse, and ignition time, and assuring that the temperature is never too high (threshold of 100 ºC).
Our ultimate goal was to create the best possible acquisition system, enabling the team to reach the full potential of each engine test performed. To this end, the Propulsion Department decided to migrate its DAQ system to the Dewesoft option, which provides reliable data acquisition hardware and software.
Alternatively, the team proposed a temporal solution involving a burst disk.
Data acquisition system
SIRIUS Modular Data Acquisition System: The Sirius module is our main system component. It processed the sensor signals and transferred them to the computer with the installed software. This DAQ model is ideal for our testing, as it includes many sensor inputs and a modular design, allowing us to expand with additional modules if needed easily.
DSI-CHG-DC Amplifier: Digital charge amplifiers that receive alimentation from the SIRIUS DAQ system.
DSI® Adapters. DSI adapters to connect thermocouple sensors to the SIRIUS amplifiers.
Sensors
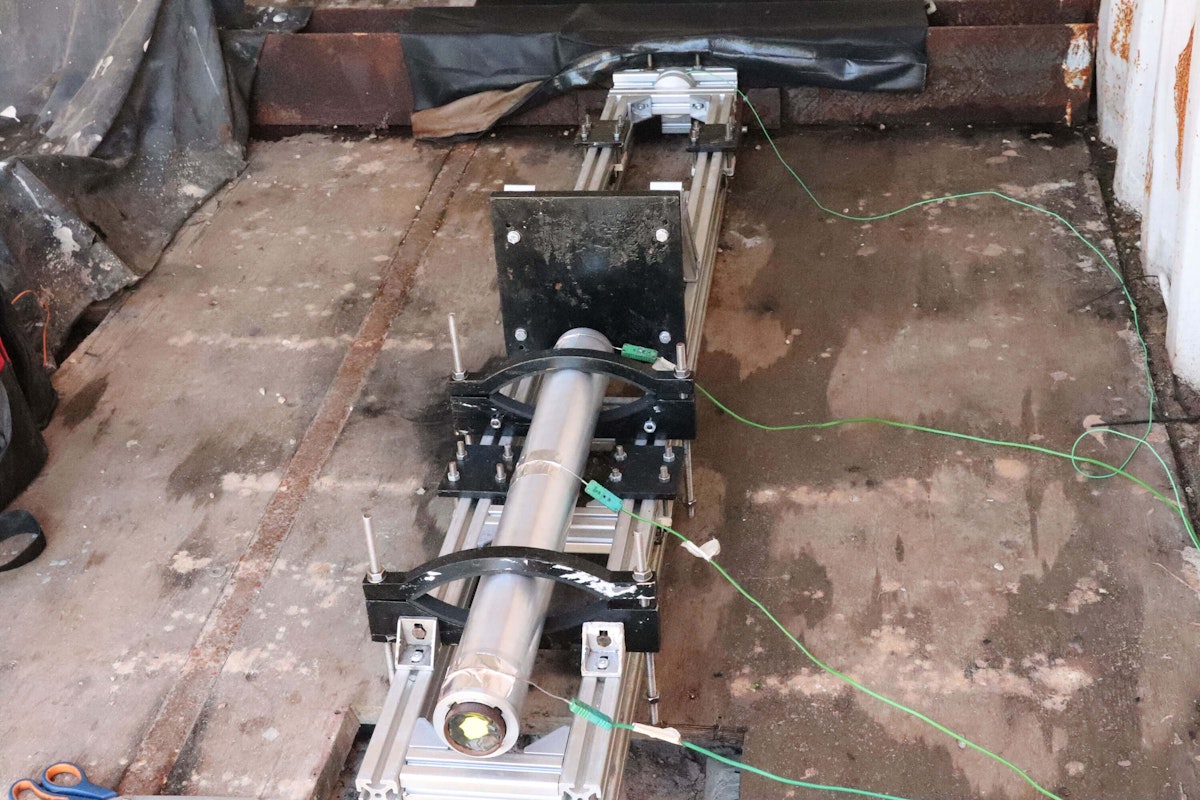
Kistler 9103C piezoelectric force sensor. Located in the upper part of the engine, it provided the thrust generated by the motor. Thanks to some implementations, it also provides impulse and specific impulse.
Two Type K Thermocouples. Three thermocouples are distributed along the longitudinal axis of the engine, enabling temperature readings at the desired spots.
DSI-ACC Adapter. Required to see if the ignition electric signal and the e-match are simultaneously activated.

, (2), and (3), and force sensors (4). Note that the nozzle is to the right in this diagram.")


Data acquisition and analysis software
For data acquisition and signal processing, we used the DewesoftX software. DewesoftX performs flawlessly, linking all our robust sensors and acquisition systems, enabling the team to extract the full potential of the hardware. This software enables deep display, processing, and several personalization layers, making it suitable for any situation, setup, and requirement.
Burst disks
A burst disk is a sacrificial part with a one-time-use membrane that fails at a predetermined differential pressure. Because of its nature, it allows us to reach higher pressures by closing the nozzle without any security concern, as we know that it will break before it reaches dangerous pressures.
Due to the late discovery and with Origin’s launch in less than two months, the department could not mechanize new metal pieces, which would have been ideal. So, we had to make a trade-off, and the only way to attach the burst disk was to cut a small concentric slot in the diverging region of the nozzle, which reduced performance but ensured it would work.
The selected material was Thermoplastic Polyurethane (TPU) because of its mechanical properties and ease of mechanization with a 3D printer.

Finally, to ensure the nozzle sealing, we filled the slot with bicomponent glue and resealed the whole setup with butyl rubber. These last two components, which provide no mechanical advantage, seal the nozzle exit long enough for pressure to build up.
With some simple isentropic flow calculations and experimental data applied to the nozzle and the burst disk, our members came up with a burst disk that, theoretically, would resist no more than 15 bar, which is more than safe, considering that the motor casing can withstand more than 70 bar.
Measurements


Figure 9 shows the software channel setup. We used analog inputs and math post-processing channels to analyze the fire test. Let’s briefly explain the ones we are interested in:
Analog channels
AI1: This channel records data that the force sensor has already amplified.
AI3 and AI5: Connect thermocouples 1 and 3, respectively. See Figure 6.
AI7: A voltage input records the sending of the ignition electric signal.
Figure 6 shows the position of each sensor and the DAQ system inputs.
Offline math channels
Thrust Cal
Calibrated thrust. After the recording, the team realized that the 9103C sensor was poorly calibrated, so the sensor output had to be corrected.
Thrust Cal/Filter
Filters the “Thrust Cal” channel, stabilizing the signal and deleting noise. The filter is an IIR filter, employing a high-order low-pass (40 Hz) Butterworth variant to remove unwanted noise. This stable signal will be our reference data stream for the rocket motor thrust.
Figures 10 and 11 demonstrate the filter’s effectiveness.


Total Impulse
Integrates the filtered thrust signal over time to give us the rocket's Total Impulse.
Isp
Using the formula explained in the theoretical concepts chapter of this document, we use the “formula” tool of DewesoftX to obtain the Specific Impulse of the rocket motor.
Data visualization
Cameras
Video recording conveniently synchronized with the other data recorded. “Camera 0” is the laptop front camera, while “Camera 1” is a camera mounted inside the testbench containment facility.
On the other hand, we divided the visualization displays into the following screens:
General Display
Gives an overview of the motor status. It contains a thrust display and a digital meter (the sensor's maximum reading at the time), a video display, and six general-purpose digital meters, three of which we use for temperature channel readings (maximum readings over the whole recording).


Thrust Display
Emphasises the thrust recorder, where we overlap the AI1 channel raw data with the real-time filtered data. Also, it shows a horizontal bar as an alternative representation of the maximum thrust, along with the maximum thrust reading as a digital meter.


Temperature Display
This display is intended to display all temperature-related information, with a graphic and several digital meters to that end, each one associated with a thermocouple.


Post-Process Display
This display shows all the information related to the thrust-related calculations. Under the thrust and filtered thrust registers, we find three digital meters that display the maximum thrust, the actual Total Impulse, and its corresponding Specific Impulse.
Test results
For this test campaign, the Propulsion Department tested 2 rocket motor configurations with 2 igniters: one without holes (Day 1) and 6g of thermite, and another with holes (Day 2) and 10g of thermite. See the two igniter brands below.
Tables 1 and 2 show the results we obtained from campaign days 1 and 2, respectively.
Test campaign, day 1
Watch the Test Campaign, Day 1 video.
| Measurement | Value |
|---|---|
| Maximum Thrust | 2180 N |
| Total Impulse | 4642 Ns |
| Specific Impulse | 195.02 s |
| Ignition Time | 4.05 s |
| Burn time | 4.87 s |
| Ignition Pressure | 12 Bar |
Test campaign, day 2
See the video below.
Table 2. Test results, Test Campaign Day 2
| Measurement | Value |
|---|---|
| Maximum Thrust | 1341 N |
| Total Impulse | 4653 Ns |
| Specific Impulse | 196.02 s |
| Ignition Time | 72 ms |
| Burn time | 4.86 s |
| Ignition Pressure | 12 Bar (at least) |


Conclusions
We will first review each day’s conclusion, then jump to a general conclusion of the whole campaign.
Test campaign, day 1
The test was the object of an anomaly. First, the delivered thrust was extremely high, given an expected maximum of around 1350 N. Also, the ignition time was more than double the longest time recorded before this test. The temperature recordings were nominal.
After analyzing the data obtained from the thrust channel, the team was able to reconstruct the ignition pressure, making use of the thermodynamic relation:
With a fully characterized propellant and knowing the nozzle geometry, Faraday was able to determine Po, the pressure in the combustion chamber, at the moment of ignition (first spike in figure 4). The value of 12 bar was astonishingly high, which verified the correct design of the burst disk, but also raised another question: if the ignition pressure was 6 times higher, why did the ignition time not reduce?
At the end, the key was the igniter chamber geometry: it had no holes. As a result, the high-temperature particles were primarily directed in one direction (normal to the igniter’s upper hole), which did not ensure a homogeneous distribution and led to the previously mentioned chuffing, clearly visible in the video and in the thrust graphic. The high thrust, a common consequence of the chuffing, supports this theory. At first glance, the solution would be to set up the igniter with the holes in its casing.
Test campaign, day 2
After implementing the holed igniter, the Propulsion Department finally was able to achieve its goal: an ignition time of 72 ms, almost instantaneous and practically negligible. The thrust values were in tune with previous simulations, and Total and Specific impulse values were somewhat higher than expected, meaning that the motor’s efficiency had improved. The temperature recordings were also nominal, as were the burn times.
We could not obtain the ignition pressure as the thrust spike during ignition completely merged into the initial burn. We assume it was at least as high as the previous day's pressure - it should be higher, since the particles spread uniformly, but we can’t guarantee it.
Final notes
The results of the tests were astonishingly precise, coinciding with previously run simulations with specialized software. The information obtained was vital for further technological development in the department. This new setup allowed us to measure and certify the motor’s positive and nominal behavior. It provided all the information needed to characterize the motor and validate its flight readiness.
Additionally, it helped us locate the problem that appeared on the first day of the campaign, allowing the team to narrow the possible causes to one and fix that flaw, then prove it was necessary. The remarkable figure of 72 ms is a huge step forward in this department’s development, significantly improving Origin’s flight in terms of security, predictability, and performance.
As stated, the previous acquisition setup had some flaws that we could improve. Thanks to Dewesoft’s technology, the whole system was unified into a unique platform, making the department’s work much easier. The entire department has widely embraced the transition to Dewesoft’s technology, with team members highlighting a noticeable improvement in their day-to-day workflows and testing processes, as well as a not-too-steep learning curve.
The intuitive software interface, combined with robust and modular hardware, has created a smoother, more integrated working environment. As a result, the team is now better equipped to tackle more demanding projects with confidence. Looking ahead, Dewesoft’s advanced tools will continue to support the team in meeting the challenges of developing more powerful and sophisticated rocket engines, enabling them to unlock their full potential.