Atualização da análise de order
O módulo de Análise de Order recebeu uma atualização importante com foco principal na otimização de desempenho. Agora, ele permite que a Dewesoft cubra as aplicações de máquinas rotativas mais avançadas com ainda menos limitações do que antes. A atualização apresenta um conjunto de novos recursos poderosos, como a capacidade de realizar a extração de orders em comparação com qualquer quantidade de referência além da velocidade. Também permite definir taxas de velocidade diretamente no software.
Curta curva de aprendizagem
De acordo com o feedback dos clientes, DewesoftX é o software de teste e medição mais intuitivo e rápido de aprender. Com suporte integrado e formação online gratuita com instruções passo a passo, estará pronto a funcionar num instante.
Exportação de dados melhorada
Um dos formatos de exportação mais amplamente usados, o Microsoft Excel (.xlsx), recebeu uma melhoria significativa. Ter o Excel instalado no mesmo PC que o DewesoftX não é mais necessário para exportar .dxd para .xsls. Além disso, o processo de exportação agora é aproximadamente duas vezes mais rápido. Observe que isso só é válido para o tipo de exportação de arquivo e não para a exportação de modelo do Excel.
Actualizações gratuitas para toda a vida
De três em três meses lançamos uma nova versão principal do software DewesoftX. Novas versões contêm optimizações de velocidade, correcções de bugs, novas funcionalidades para funções básicas e novas funções para processamento de sinais e módulos matemáticos. Todas as actualizações de software são completamente gratuitas para todos os utilizadores existentes.
Espaço ilimitado para licenças
Pode utilizar o equipamento de medição Dewesoft com qualquer PC que tenha o DewesoftX instalado. Depois de guardar os dados num ficheiro, pode partilhá-los com qualquer número de pessoas. Podem utilizar o software para ler, visualizar e analisar os dados sem terem de adquirir licenças de software adicionais.
Plug-and-play
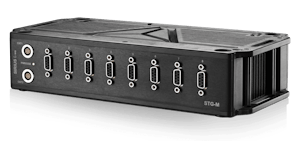
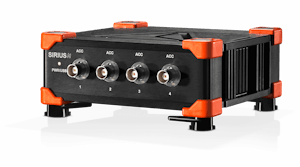
O software DewesoftX é fornecido com todo o hardware de aquisição de dados Dewesoft, que funciona de acordo com o princípio plug-and-play. Assim que o hardware DAQ é ligado, é reconhecido pelo software, é chamada a configuração correcta do canal e, graças à tecnologia TEDS, os sensores ligados são automaticamente configurados.
Suporte para interfaces de dados alargados
O software DewesoftX permite registar dados de várias interfaces de dados em perfeita sincronização. São suportados sensores analógicos, sensores digitais, câmaras, receptores GNSS, CAN, XCP/CCP, Flexray, Ethernet, OPC UA, Siemens S7, dados seriais, IRIG-106 Capítulo 10, PCM, ARINC 429, MIL-STD-1553 e muitos mais.
Imagens impressionantes
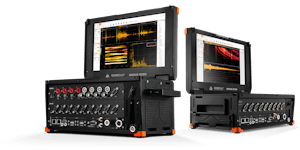
Mais de 35 widgets de visualização vêm como padrão e podem ser personalizados pelo utilizador. Desde simples visualizações de gravadores a gráficos avançados em 3D com gráficos de barras e mapas interactivos. As visualizações utilizam a aceleração do hardware para assegurar um desempenho suave e óptimo.
A matemática no processamento de sinais
Tirar partido de uma biblioteca interminável de módulos matemáticos e de aplicação matemática. Desde fórmulas simples, operações estatísticas e opções de filtragem a matemáticas avançadas de processamento de sinais, tais como análise modal, análise de potência, FFT, acústica e muito mais.
Carregar ficheiros de dados em segundos
Os ficheiros de dados podem ter vários gigabytes e até centenas de gigabytes. Independentemente do tamanho dos dados, o DewesoftX abre qualquer ficheiro em segundos. Ele estará pronto para ser revisto ou analisado imediatamente. Isto é possível devido à estrutura inovadora dos ficheiros de dados.
Exportação simples de dados
DewesoftX pode exportar dados registados para mais de 25 formatos de dados padrão da indústria. Se precisar de dados em Microsoft Excel, Matlab, ASAM MDF ou num formato universal, estamos prontos para o ajudar. As exportações de dados personalizados podem ser escritas para programadores.
Construir relações como um profissional
As ferramentas de relatórios incorporadas permitem passar de medições a belos relatórios em formato PDF ou Microsoft Word em segundos. Os suplementos para o Microsoft Word fornecem actualizações em tempo real de todos os widgets visuais directamente no ficheiro Word.
Automatização de testes
Com a ferramenta de sequenciamento integrada, pode automatizar completamente os procedimentos de teste ou qualquer outro aspecto do software DewesoftX. Criar um UIX simples que os controladores de teste ou outros operadores de teste possam funcionar sem esforço.
Aquisição e visualização de dados sincronizados
DewesoftX pode adquirir, analisar e visualizar dados de várias interfaces de dados como analógica, digital, contadores, CAN / CAN FD bus, XCP, CCP, FlexRay, EtherCAT, Ethernet e muitos outros.
Fale a sua língua
DewesoftX foi traduzido e localizado em 14 línguas, por isso é provável que fale a mesma língua que você.
Qualidade Dewesoft e garantia de 7 anos
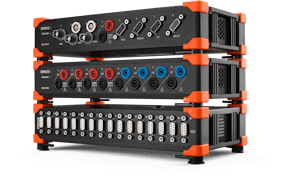
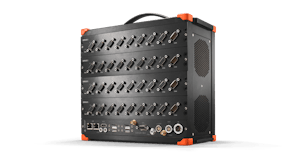
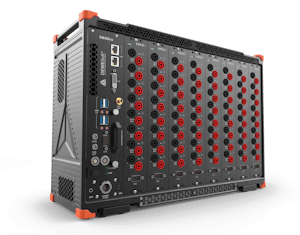
Aproveite nossa garantia de 7 anos líder do setor. Os nossos sistemas de aquisição de dados são fabricados na Europa, utilizando apenas os mais elevados padrões de qualidade de construção. Oferecemos suporte técnico gratuito e focado no cliente. Seu investimento nas soluções Dewesoft estará protegido por muitos anos.

