Table of contents
Browse categories
Browse authors
 AL
ALAlessia Longo
 AH
AHAl Hoge
 AB
ABAljaž Blažun
 BJ
BJBernard Jerman
 BČ
BČBojan Čontala
 CF
CFCarsten Frederiksen
 CS
CSCarsten Stjernfelt
 DC
DCDaniel Colmenares
 DF
DFDino Florjančič
 EB
EBEmanuele Burgognoni
 EK
EKEva Kalšek
 FB
FBFranck Beranger
 GR
GRGabriele Ribichini
Glacier Chen
 GS
GSGrant Maloy Smith
 HB
HBHelmut Behmüller
 IB
IBIza Burnik
 JO
JOJaka Ogorevc
 JR
JRJake Rosenthal
 JS
JSJernej Sirk
 JM
JMJohn Miller
 KM
KMKarla Yera Morales
 KD
KDKayla Day
 KS
KSKonrad Schweiger
Leslie Wang
 LS
LSLoïc Siret
 LJ
LJLuka Jerman
 MB
MBMarco Behmer
 MR
MRMarco Ribichini
 ML
MLMatic Lebar
 MS
MSMatjaž Strniša
 ME
MEMatthew Engquist
 ME
MEMichael Elmerick
 NP
NPNicolas Phan
 OM
OMOwen Maginity
 PF
PFPatrick Fu
 PR
PRPrimož Rome
 RM
RMRok Mesar
 RS
RSRupert Schwarz
 SA
SASamuele Ardizio
 SK
SKSimon Kodrič
 SG
SGSøren Linnet Gjelstrup
 TH
THThorsten Hartleb
 TV
TVTirin Varghese
 UK
UKUrban Kuhar
Valentino Pagliara
 VS
VSVid Selič
 WK
WKWill Kooiker
Automating Resistivity Measurement Using the Four-Point Probe Method
César Besançon-Mathil, Tomas Dias Botelho, and Younes Makoudi
Marie and Louis Pasteur University (UMLP), and FEMTO-ST Institute
November 12, 2025
To measure the resistivity of thin films more accurately and efficiently, students at the FEMTO-ST Institute automated the four-point probe method. A system combining a Keithley Source Measure Unit, MonoDAQ hardware, DewesoftX software, and Python scripting enabled the production of precise and repeatable results. The project automates a previously manual process, allowing faster and more reliable materials research in micro- and nanoscale applications
The FEMTO-ST Institute (Franche-Comté Électronique Mécanique Thermique et Optique - Sciences et Technologies) is associated with the Marie and Louis Pasteur University (UMLP), formerly the University of Burgundy - Franche-Comté.
The institute is a joint research unit between the French National Centre for Scientific Research (CNRS), the largest fundamental science agency in Europe, and three higher education institutions:
The Marie and Louis Pasteur University,
National School of Mechanics and Microtechnology (Supmicrotech) (École nationale supérieure de mécanique et des microtechniques), and
Belfort Montbéliard University of Technology (UTBM) (Université de Technologie de Belfort-Montbéliard)
The project took place in the FEMTO-ST laboratory in Montbéliard, within the MINAMAS team, which specializes in micro- and nanoscale materials and surfaces. MINAMAS is a research group comprising twelve permanent researchers—professors, associate professors, CNRS researchers, an engineer, two technicians, and a few postdoctoral researchers —as well as five to ten PhD Students. Each year, the group also welcomes Master's and Graduate Students for a few months.
This groundbreaking project was spearheaded by two second-year students in the Bachelor of Science in Technology (BUT) in Physical Measurements at the IUT. Their program, which equips them with skills in instrumentation, metrology, and material analysis, was instrumental in designing and implementing innovative solutions in the field of physical measurement.
The issue - resistivity measurement automation
The MINAMAS team's work is particularly significant in the field of photovoltaics, which involves converting light into electricity using materials that exhibit the photovoltaic effect. Here, accurately measuring resistivity is not only a technical requirement but also a crucial step towards optimizing the performance of thin-film materials for various applications.
Electrical resistivity is a fundamental specific property of a material that measures its electrical resistance, or how strongly it resists electric current.
The thin films are fragile, so the power flowing through them should be as low as possible to avoid any damage. Because of this, it is necessary to produce a small and precise current in the μA range and to sense small voltages in the μV range.
The lab’s previous method for measuring the resistivity of thin films was a manual process that had several shortcomings. It required extensive manual handling, significant time, and did not account for the pressure applied by the probes. These issues often resulted in imperfect and inconsistent outcomes, underscoring the need for a more efficient and reliable system.
The four-point probe method
Traditional two-point probe measurements can be inaccurate due to the voltage drop caused by the resistance of the probes' leads and by the contact resistance between the probes and the sample. The four-point probe method overcomes this limitation by using separate current and voltage probes. It minimizes the impact of contact resistance, allowing for more accurate measurements of the material's intrinsic resistivity.
The Four-Point Probe method can accurately measure the electrical resistivity or sheet resistance of a material, particularly thin films and semiconductors. It achieves this by using four equally spaced probes.
Engineers can implement the method with probes arranged in a linear or square configuration, and correction factors may be necessary based on the probe geometry and sample size.
For probes arranged in a linear configuration, a precisely known current is passed through the outer two probes while measuring the voltage drop across the inner two probes. Since almost no current flows through the voltage measuring probes, the measurement virtually eliminates the impact of contact resistance. This setup helps isolate the material's resistance from the resistance of the probe leads and the contact resistance at the probe interfaces.
Researchers and engineers widely use this method in materials science, the semiconductor industry, and geology to characterize the electrical properties of various materials. It's beneficial for measuring the resistivity of thin films, semiconductors, and other materials where contact resistance can be a significant factor, according to Linseis and Number Analytics.
Semiconductor manufacturers use four-point probes to measure the sheet resistance of thin films, and then use this measurement to calculate doping concentrations.
The set-up
MonoDAQ is a compact, multifunctional USB data acquisition (USB DAQ) device. Our initial approach to creating a new measurement setup was to use the MonoDAQ alone. Still, this device is incapable of accurately producing such low currents, and we found no solution to process the results automatically in the data acquisition and digital signal processing software, DewesoftX.
We then decided to use a Keithley Source Measure Unit (SMU) to generate the currents and sense the voltages, a MonoDAQ to monitor the pressure, and a Python script to process and save the data, as well as interface with the user.
Keithley's Standard Series 2400 SMU Instruments offer four-quadrant precision voltage and current source/load coupled with measurement.
To address these issues, we implemented a new measurement setup:
A Keithley 2400 Source Meter, controlled by a Python script, was introduced to automate electrical measurements.
A MonoDAQ U-X module was used along with DewesoftX to measure and regulate the pressure applied by the probes, ensuring consistent pressure across all samples.


We used a Force-Sensing Resistor (FSR) to measure the pressure applied; however, this type of sensor is not well-suited for this application. Changing to another technology would only require changing the DewesoftX setup file, so we decided to use this sensor and simulate the pressure.

The equipment used
As of now, the equipment required is:
Jandel multi-position wafer probe stand,
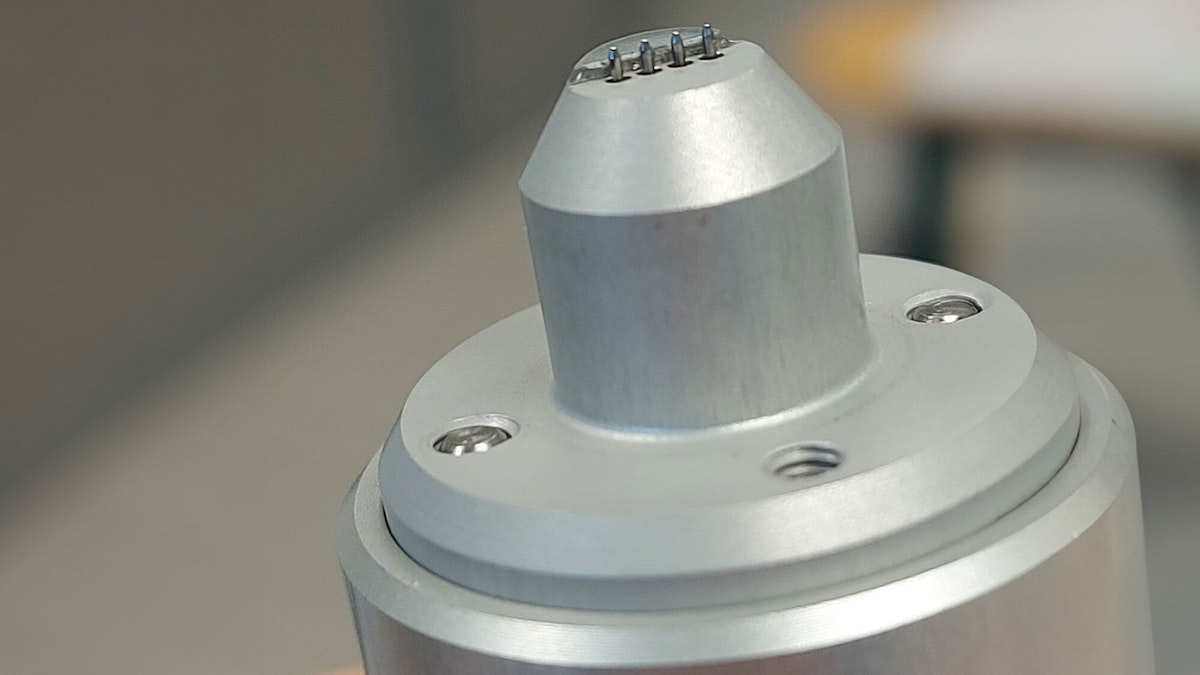
Jandel cylindrical four-point probe head,
Keithley 2400 Source Measure Unit (SMU),
CP 151 FSR pressure sensor,
Computer equipped with DewesoftX and Python,
RS232 to USB adapter.


The implementation
The first step was to read the pressure sensor using the MonoDAQ. The pressure sensor used is a force-sensing resistor, whose resistance decreases as the pressure increases. To measure the resistance, we use a simple voltage divider.


The DewesoftX setup file permits the easy processing of the sensor’s output outside the Python script. As the sensor is temporary, the output is only the measured resistance of the sensor.
Our second step was to use DCOM (Distributed Component Object Model) to retrieve sensor data from DewesoftX and send it to the Python program. Additionally, we utilized the pyVISA library to communicate with the Keithley using SCPI (Standard Commands for Programmable Instruments). The SCPI permits us complete control of the instrument and enables the program to perform numerous precise measurements in a short amount of time.
The next part was to process and save the data. When plotting the voltage against the current, the slope is the resistance of the sample.


This resistance can be verified by measuring known resistances. The resulting graph should be a straight line passing through the origin.
After that, we can calculate the resistivity with the formula:
Where 4.532 is a factor associated with the shape of the probe array, and t is the thickness of the thin film in cm. By comparing the results with those found using the old method, we can confirm the system's accuracy.
The system stores every measurement in a separate file, which contains the measurement parameters and the results. At the end of the program, we combine those files into a single one.
The final part of the project involved integrating all functions into a single Python script. This script was designed as a state machine, allowing for easy modification of features without requiring a complete rewrite of the code each time. This approach not only streamlined the process but also made the system more adaptable to future changes and improvements.


The measurements
To conduct a measurement, we must start the Python program by clicking on the “main.py” file. A command-line interface appears, and a short amount of time is needed to set up communication between the program and the MonoDAQ.

Once everything is ready, the pressure measurements begin, and you can set up the sample. When the pressure is within the set interval, the program will ask for the parameters of the measure:
The name of the file, which saves everything,
The name of the sample tested,
The thickness of the sample (in μm),
The maximum current that will traverse the sample,
The number of measures to perform.
The system will ask if the entered values are correct; if so, it performs the measurement. After a couple of seconds, it displays the results as a graph and in the command line interface.
After a measurement, it is possible to save the results and perform another measurement using the same parameters or new ones. At the end of the program, the system creates a single file containing all measured values and results in the same directory as the Python program.
Results and conclusion
The project yielded a program capable of measuring thin-film resistivity with enhanced accuracy, while storing data in a format suitable for analysis. This solution optimizes the measurement process, ensuring high reproducibility of results, particularly when using the Four-Point Probe method—an industry-standard approach for minimizing contact resistance and enhancing precision.
Although the pressure measurement is not yet functional, implementing a suitable sensor such as a load cell would be straightforward, requiring only an update to the DewesoftX setup file. Future improvements include adding a graphical user interface and enhancing error handling for greater usability and robustness.
Overall, this project successfully automated a critical measurement process in materials science. It showcases the power of combining DewesoftX, Python scripting, and Four-Point Probe techniques to streamline resistivity testing for research and industrial applications.
We managed to improve our skills, particularly in programming, and to persevere through the many challenges we faced.
References
An overview of various methods used to measure resistivity: Thin Film Surface Resistivity.

